How traceroute in the Synthetic Monitoring plugin for Grafana Cloud helps network troubleshooting
One of the powerful tools available in Grafana Cloud is Synthetic Monitoring, a black box monitoring solution that can provide insights that are hard to get in other ways. It provides a different view of your application by observing performance and uptime externally and from all over the world. As a result, you can build an understanding of what your end users are actually experiencing.
However, as great as it is, synthetic monitoring does have limitations. Because the collected data comes from external requests traversing the public internet, you don’t get access to the same information you would have in a traditional white box monitoring tool.
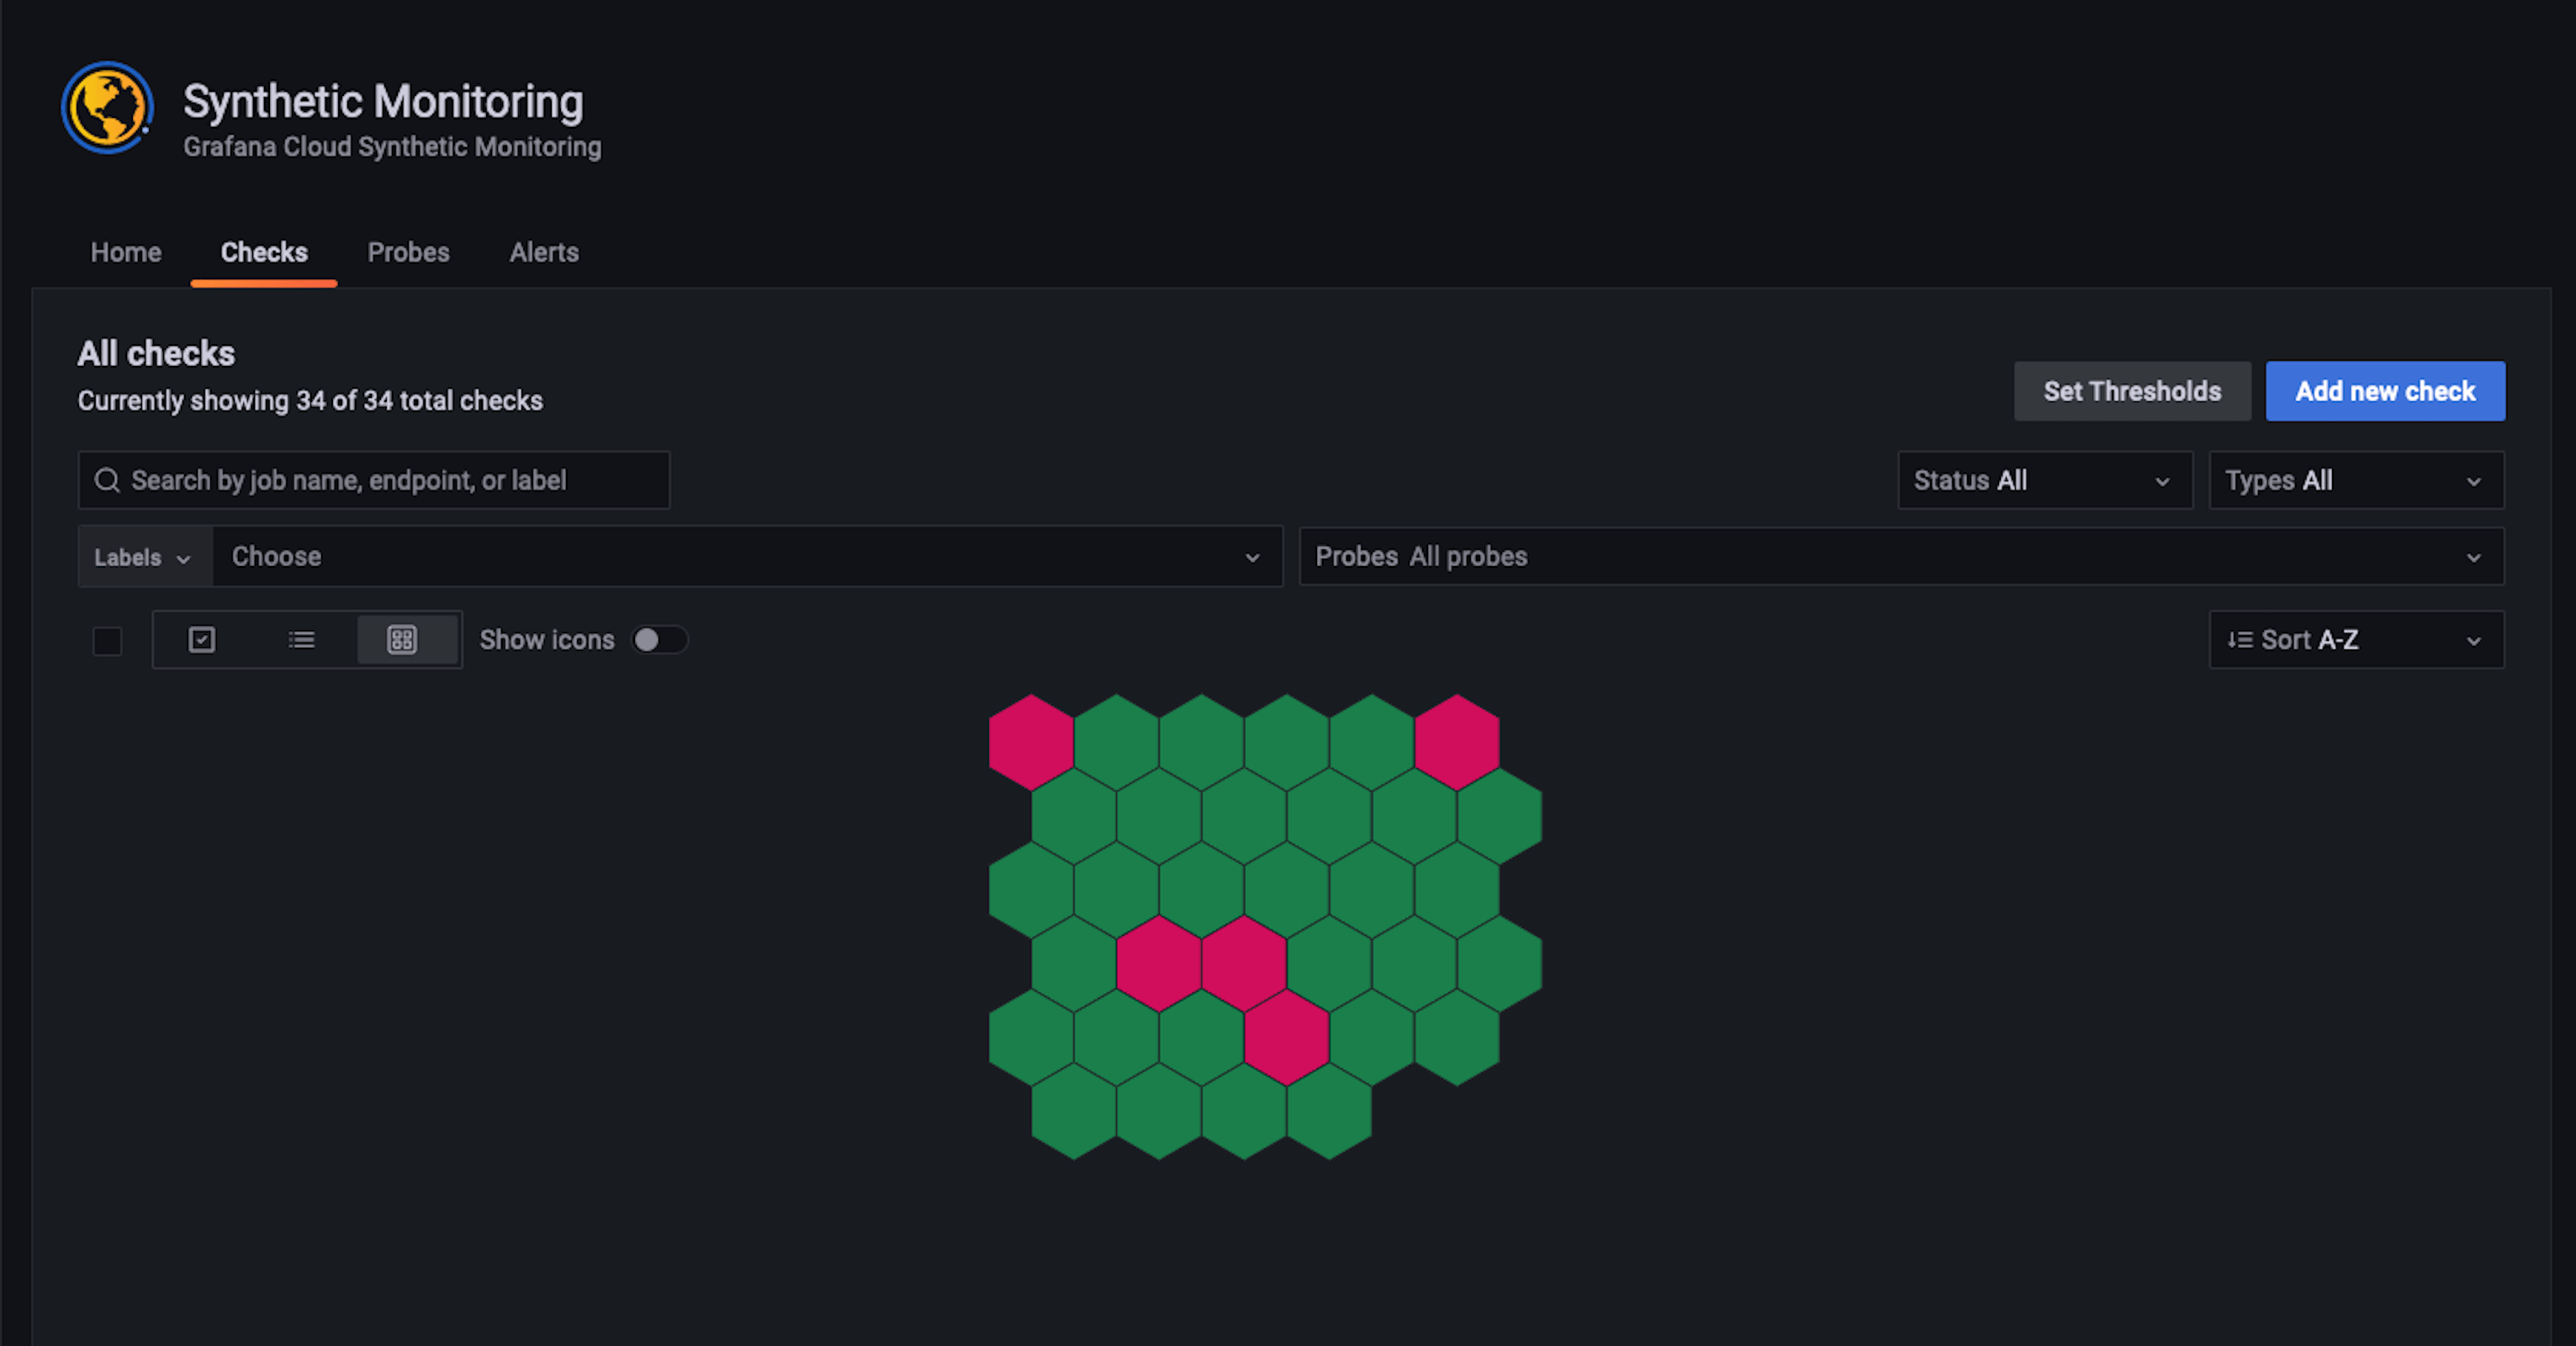
As a result, synthetic monitoring is typically used to simply find out whether a request succeeded or failed, and how long it took. With those two pieces of information, you can visualize an up/down view of your services, as seen in the Synthetic Monitoring plugin in Grafana Cloud:
But what if you wanted to know more about why a request succeeded or failed?
The next level
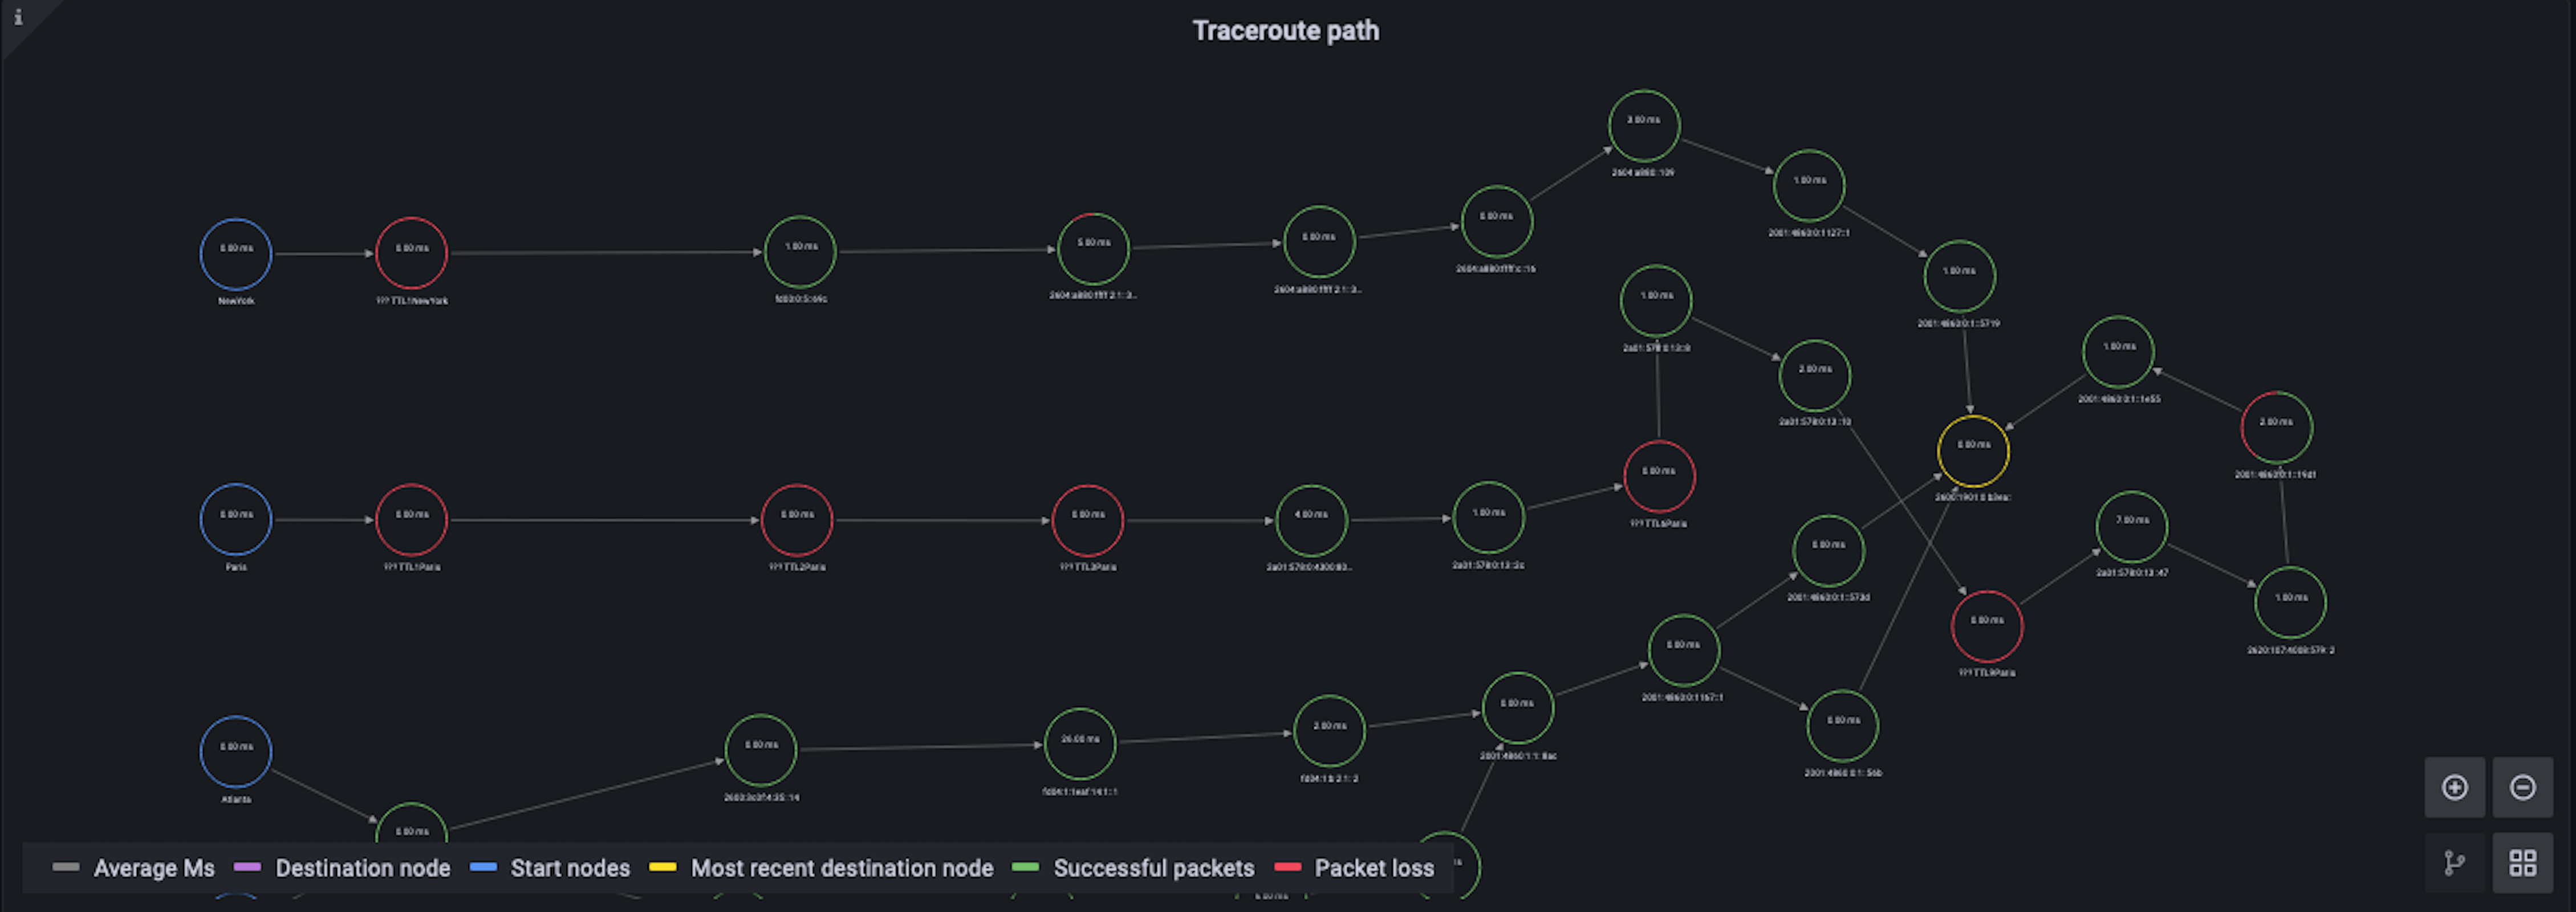
Enter a new type of Synthetic Monitoring check: traceroute. What this new feature does is trace the path of a request through the Internet, giving you a bit more information about where things might be having trouble between the client and the server. So now, with traceroute and Grafana Cloud, you’re able to do several things:
Visualize a network path . . .
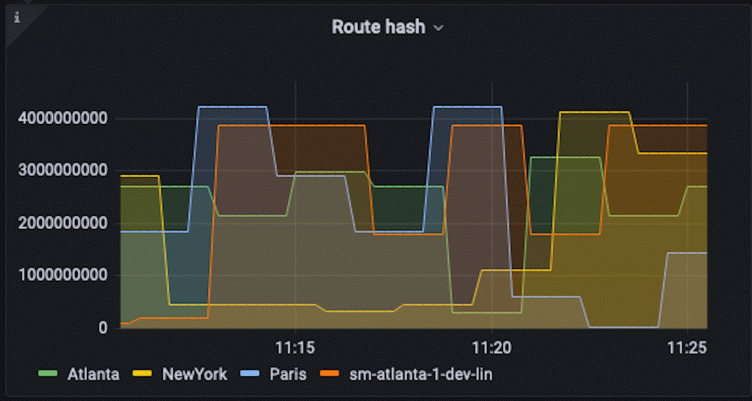
. . . whether that path is changing over time . . .
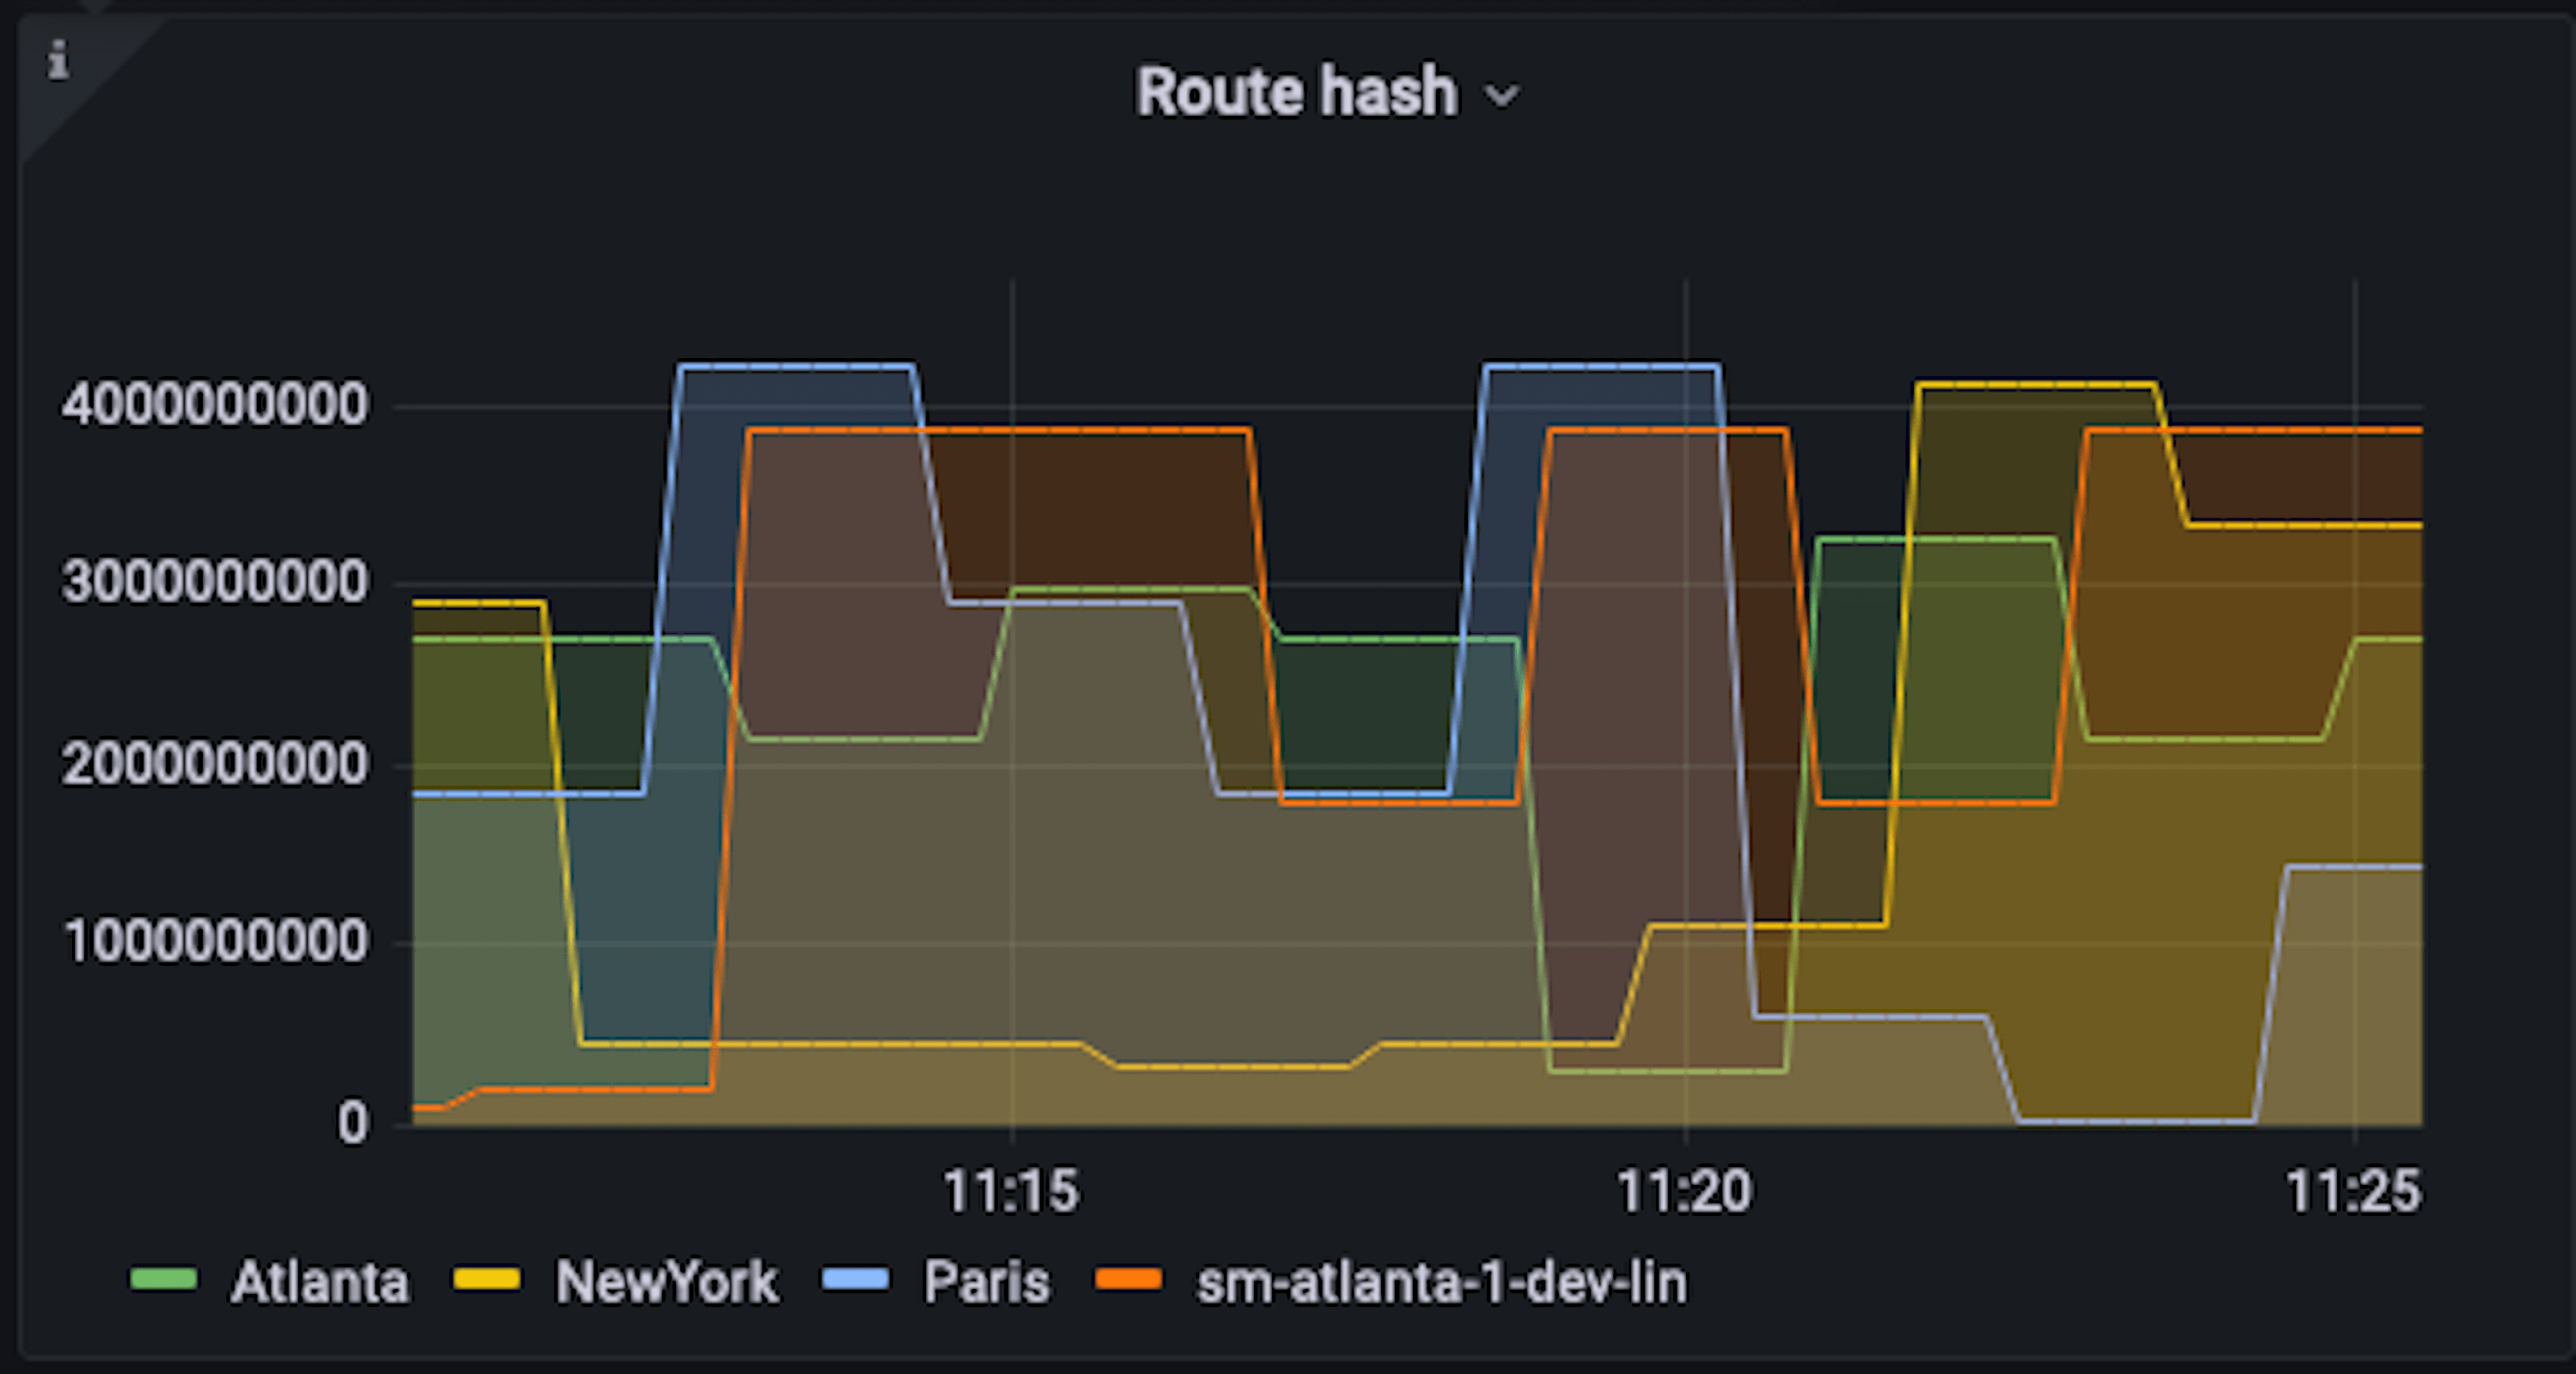
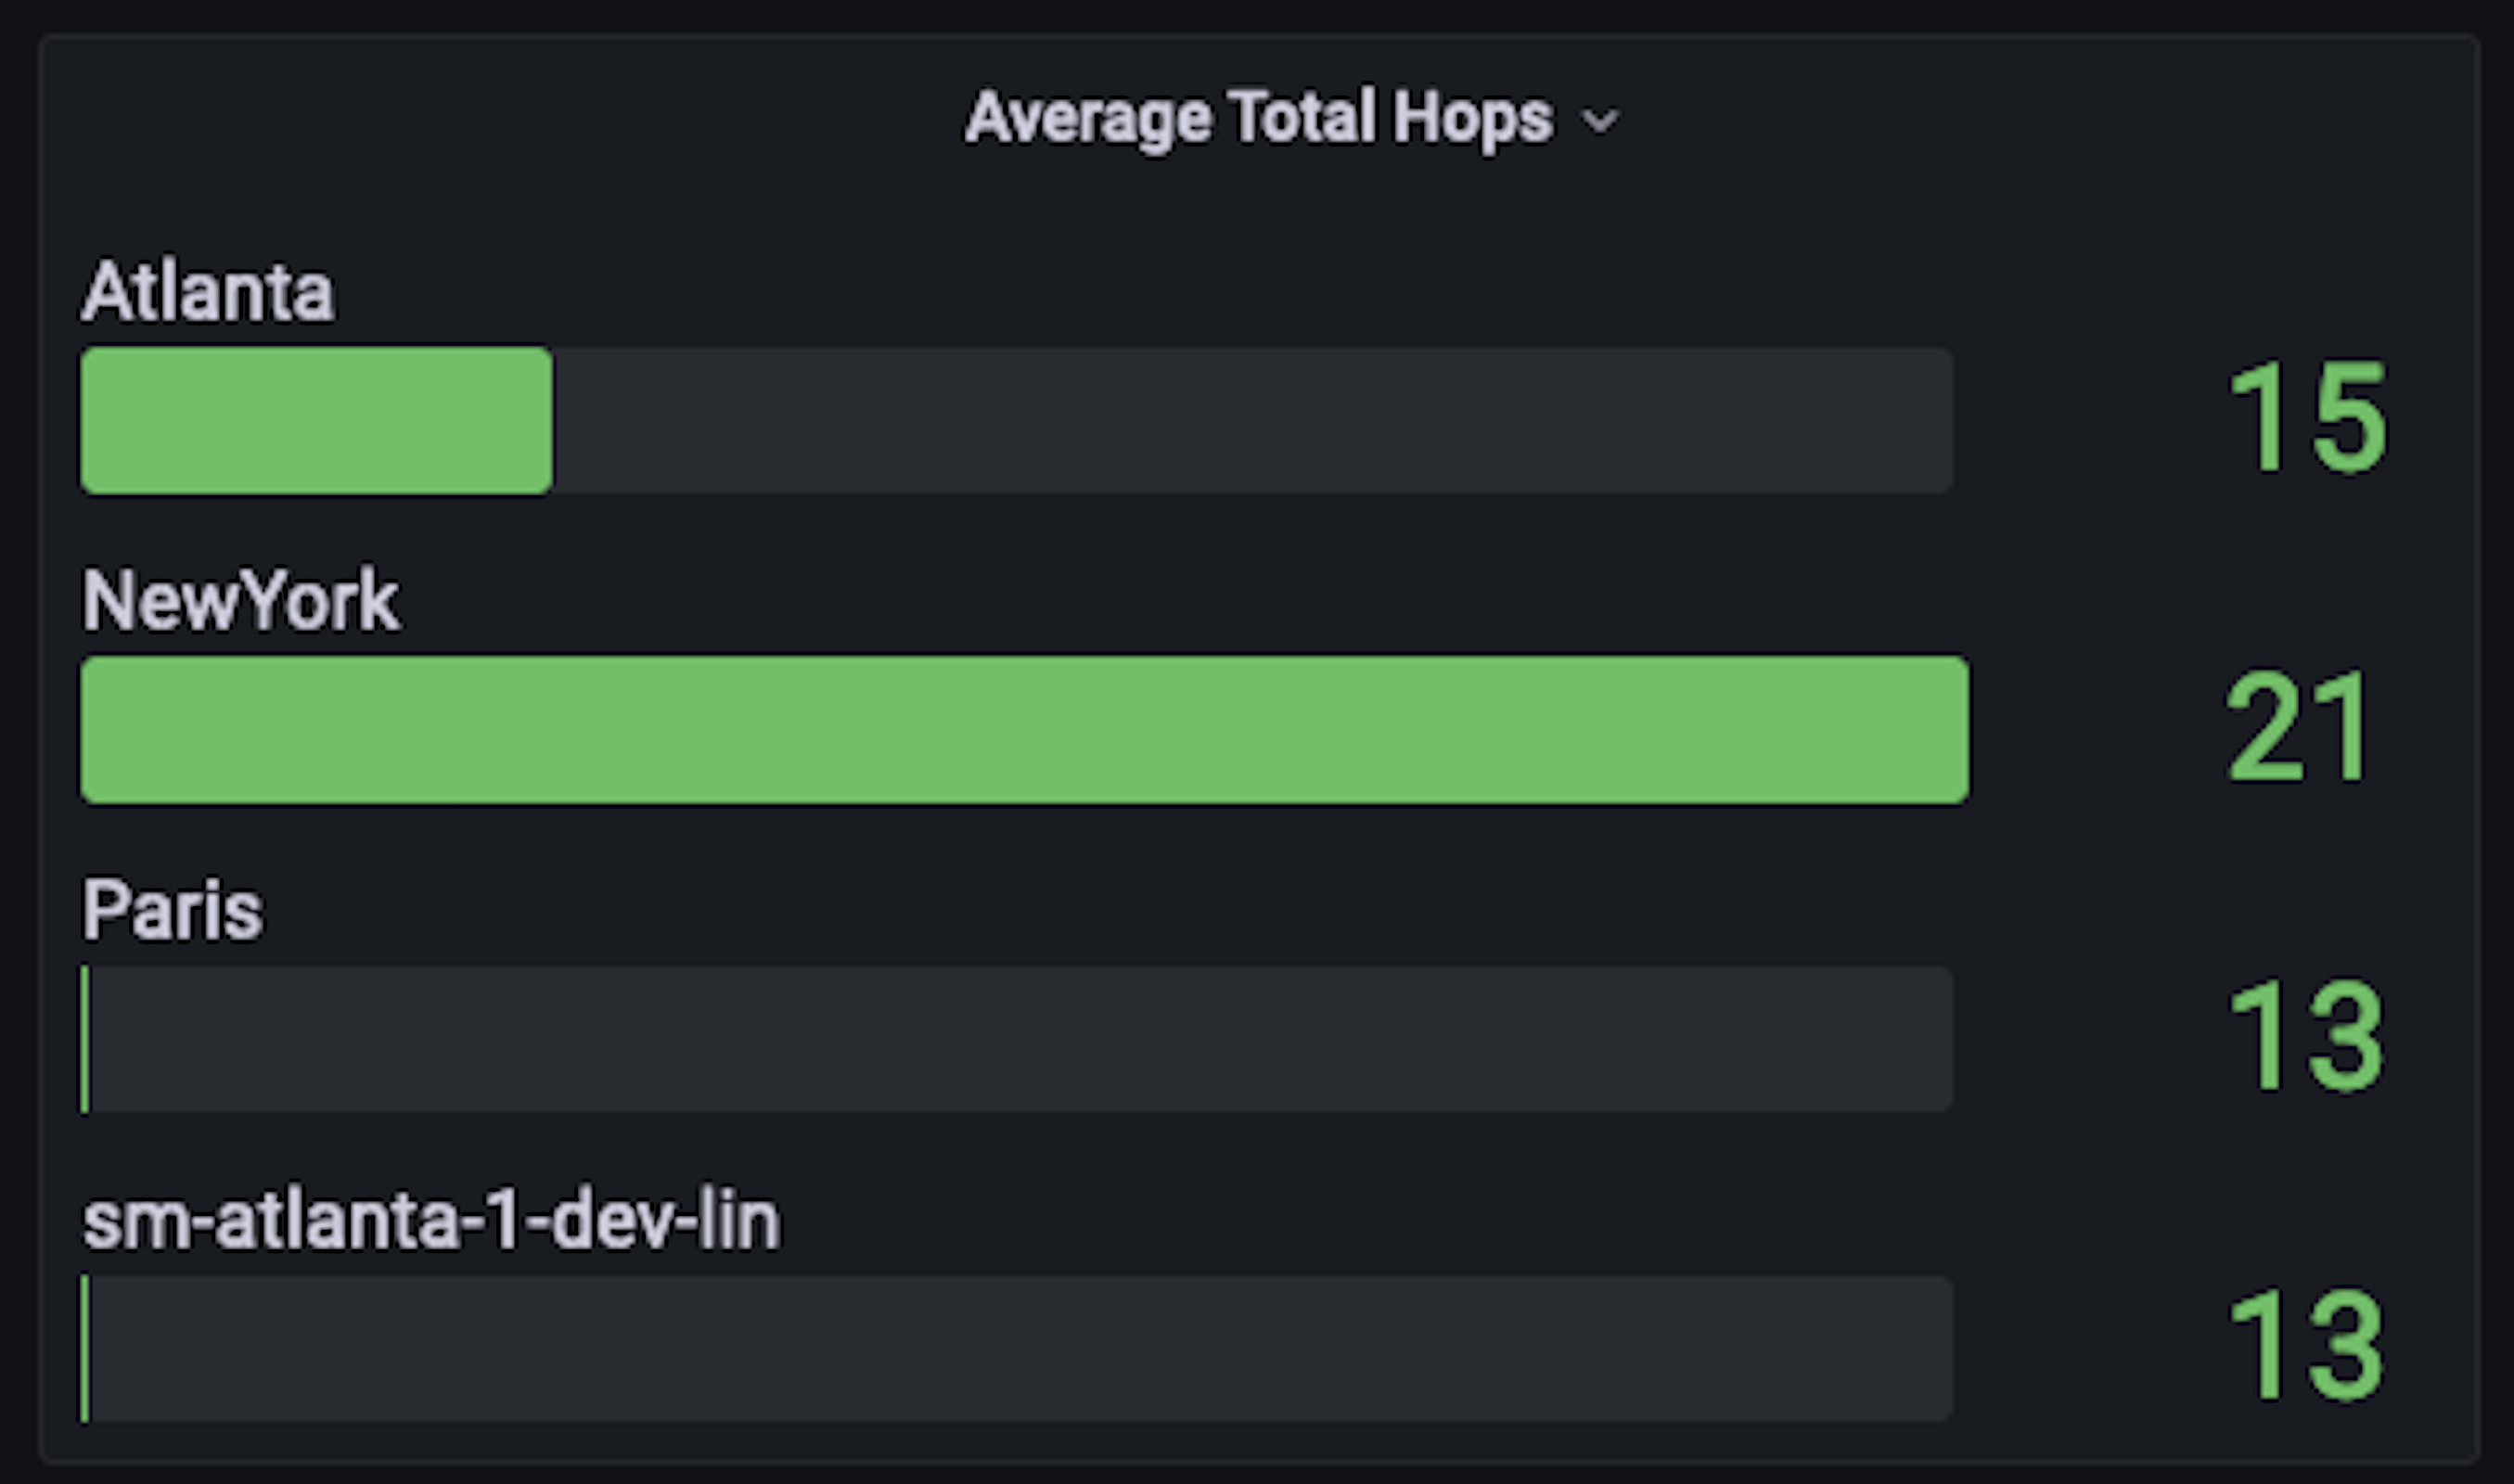
. . . and how many hops there are to reach a destination.
The payoff
Traceroute is an ideal tool to use for digging deeper into the network because it gives you more information about what’s happening between your end users and your app servers. It not only helps you see what is happening but also why.
It can also help detect whether issues are originating from inside or outside your network, and why your customers might be experiencing issues even if your server is up and running. If a check fails for some locations and works for others, that’s a good indication that the problem is external to your network. Traceroute allows you to resolve the ambiguity because it shows you where the traffic is stopping. Checks can be set up like any other check in Synthetic Monitoring, no special configuration is required.
We’re actively looking for feedback on where to take traceroute next, so let us know how it’s working out for you on GitHub or in the community forum.
To learn more about Synthetic Monitoring, check out our docs, the plugin installation guide, or watch our webinar.
Grafana Cloud is the easiest way to get started with metrics, logs, traces, and dashboards. We have a generous free forever tier and plans for every use case. Sign up for free now!


