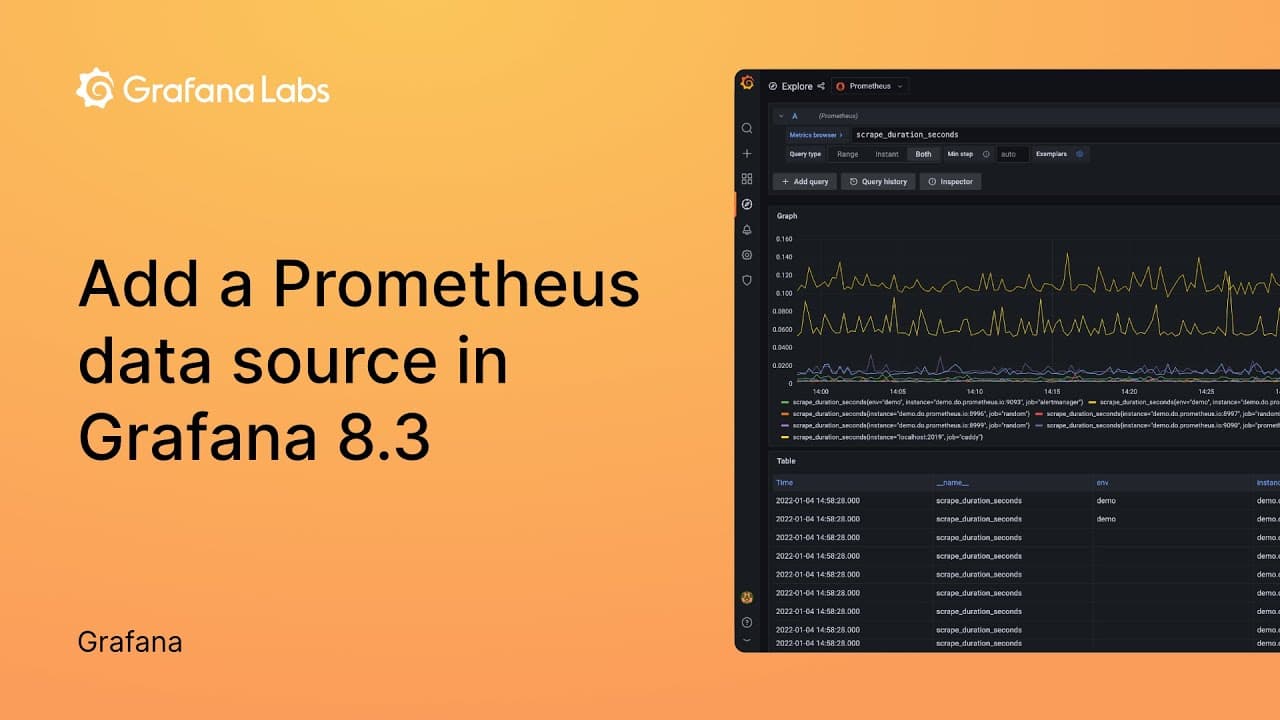
Video: How to set up a Prometheus data source in Grafana
Grafana is interoperable with more than 100 data sources. But out of all of those we offer under our “big tent” philosophy, one consistently rises to the top: Prometheus.
And it’s no wonder: Once Grafana and Prometheus are configured, the possibilities are endless. You can introduce basic network monitoring to your stack and monitor GitHub repositories, or you may find yourself tracking the efficiency of 3D printing projects and rickrolling your friends. (You’re welcome!)
In this step-by-step tutorial video, we’ll show you how to connect Grafana and Prometheus and walk you through how to customize settings such as authentication details and scrape intervals — all in less than 60 seconds!

To learn more about setting up a Prometheus data source, please refer to our documentation. You can also watch “Intro to metrics with Grafana: Prometheus, Graphite, and beyond” to see Grafana and Prometheus in action.
The easiest way to get started with Grafana and Prometheus is with Grafana Cloud. Our free forever tier now includes 10K metrics series, 50GB of logs, and 50GB of traces. Sign up for free today!


