

How to Streamline Infrastructure Monitoring with Sensu, InfluxDB, and Grafana
“To start, your monitoring stack should not cost you stacks,” Sensu Software Engineer Nikki Attea told the crowd at GrafanaCon L.A. “Avocado toast is really expensive. But the good news is your monitoring solution doesn’t have to be.”
To prove it, Attea presented an easy developer-centric use case that leverages Sensu, a monitoring event pipeline which collects, processes, and roots different event types including discovery, availability, telemetry, and alerts.
“The pipeline makes Sensu extremely powerful and completely customizable. So just think Nagios on steroids,” Attea said.
The company offers multiple mechanisms to monitor performance metrics, whether for applications or for infrastructures.
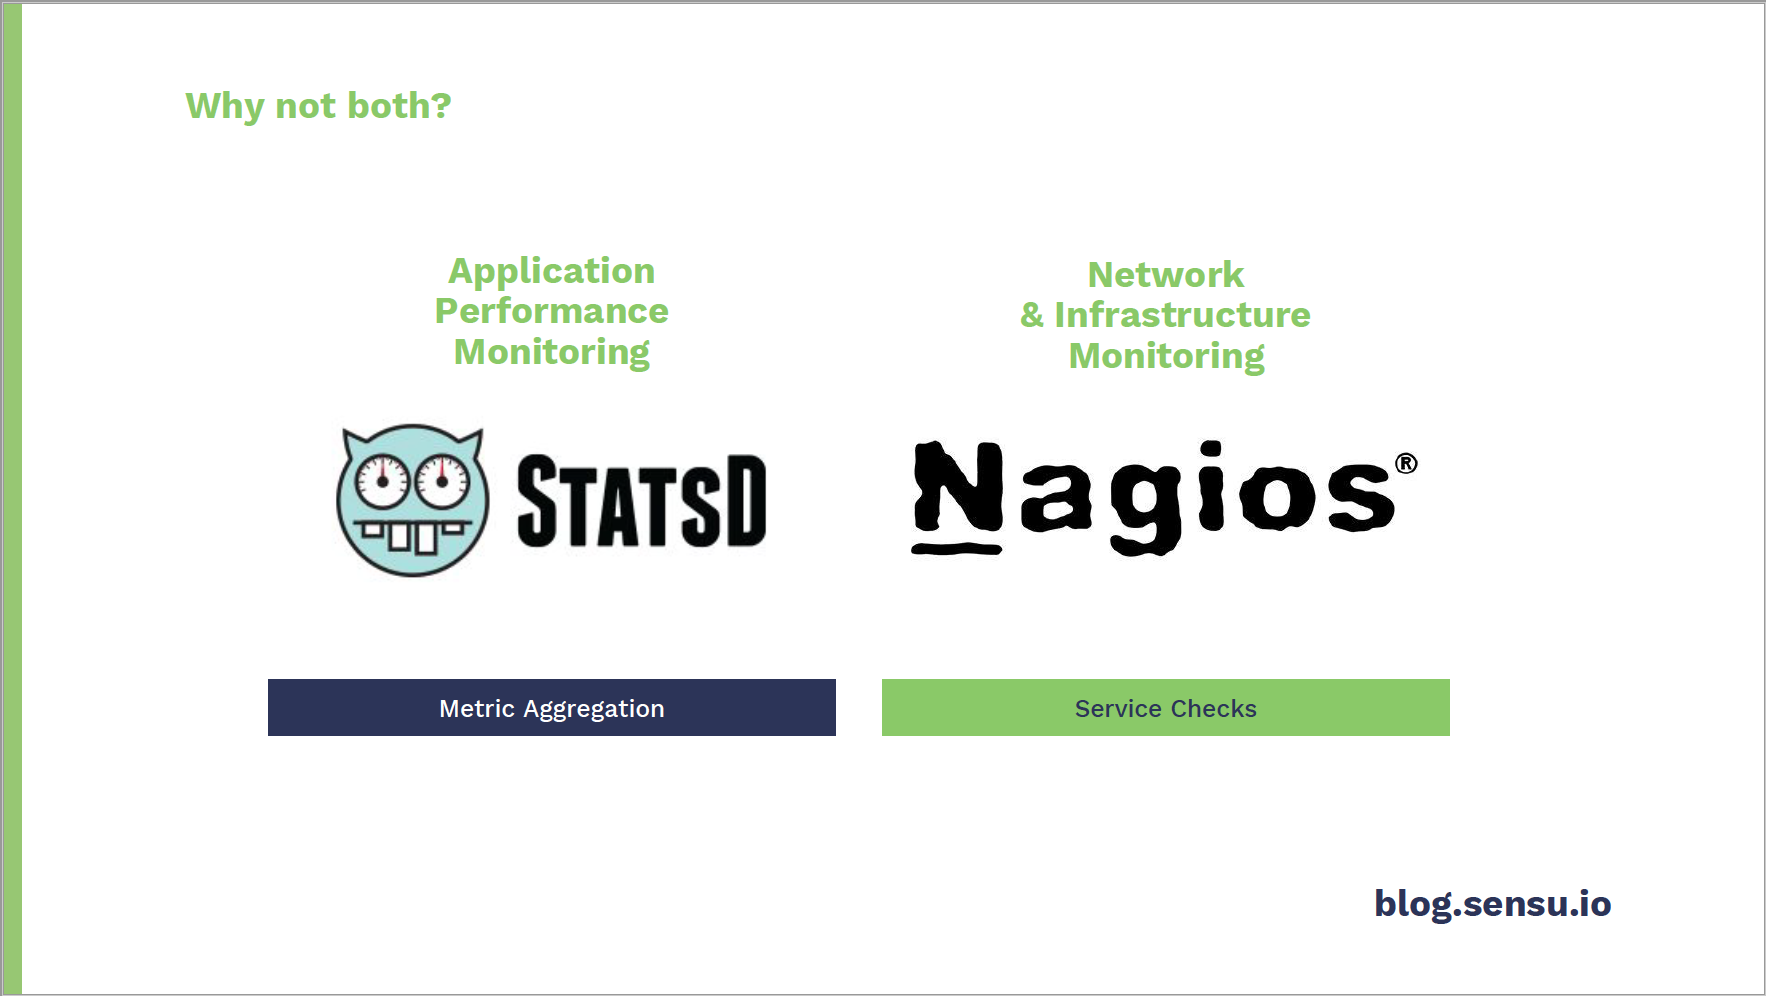
With StatsD – a metric aggregator used to collect values such as gauges, counters, timers, sets – Sensu agents have an embedded StatsD daemon that listens for UDB traffic. Read more about this service on the Sensu blog.
To monitor infrastructure, Sensu service checks collect data on monitored nodes and follow the same protocol as Nagios service checks. Each Sensu agent runs the collection of checks, and each check will output data, produce an exit code, and indicate a specific state. Sensu then parses the check output and produces metrics.
While Attea focused on service checks at GrafanaCon, she said, “Spoiler alert: The more complex your stack gets, you’ll probably want both [checks and metrics].”
Using a simple stack including Sensu, InfluxDB and Grafana – all open source tools with enterprise counterparts – Attea walked through how Sensu service checks work with Grafana to visualize data and improve monitoring.
Output Metric Extraction
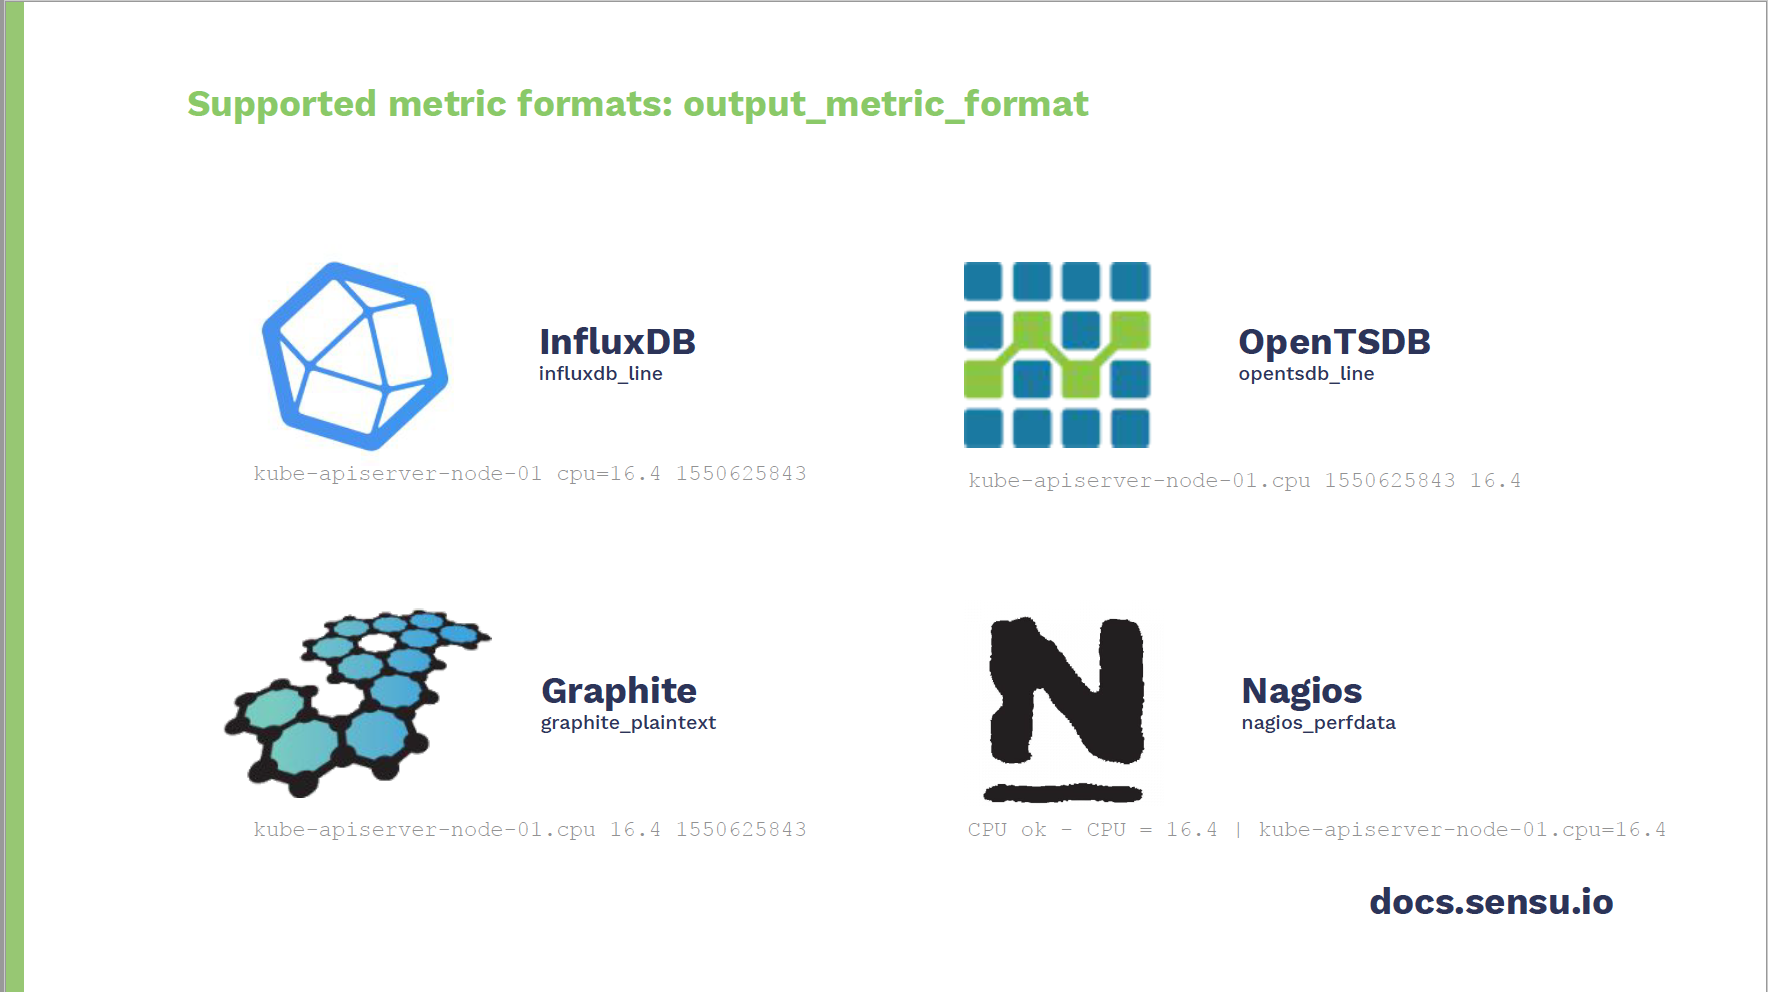
Sensu currently supports four different metric formats: InfluxDB Line Protocol, OpenTSDB, Graphite, and Nagios Performance Data.
“The key below each type is the identifier that you would use to define in a given Sensu check configuration,” said Attea. “This determines which format in the check output should be parsed and mapped to the field output metric format.”
In addition, “Sensu actually supports a wide variety of built-in metric protocols and basically limitless plugin potential to store them,” said Attea.
Sensu Check Configuration
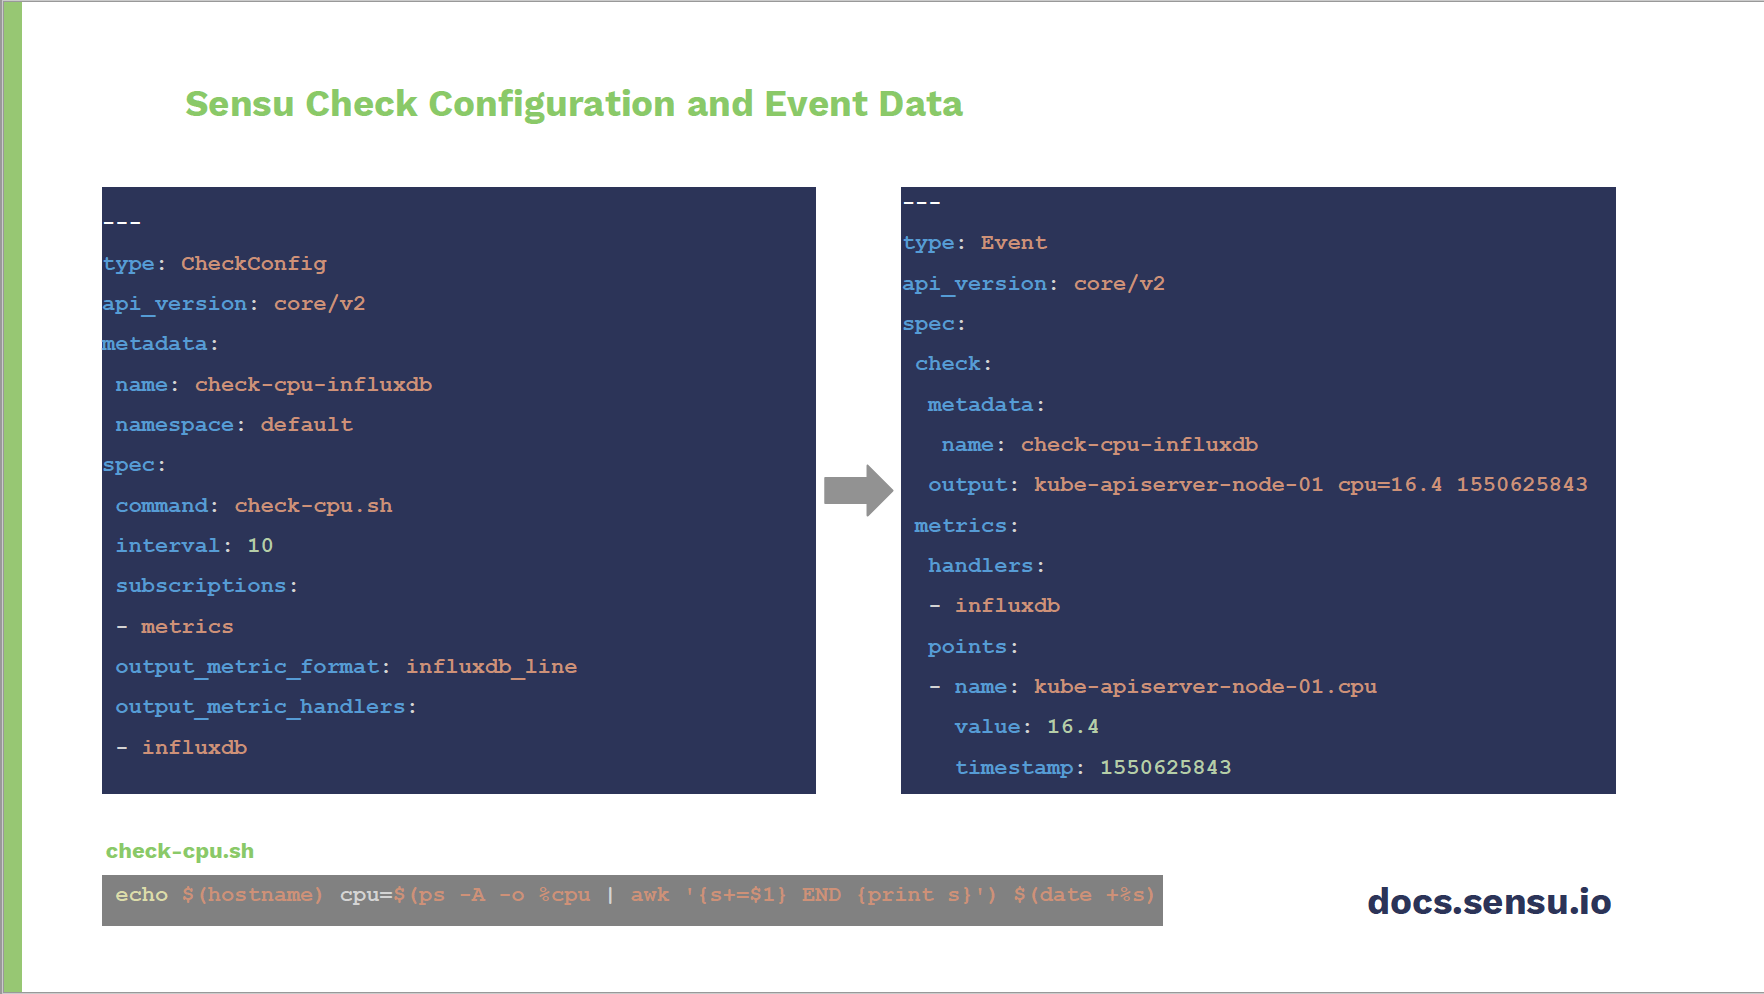
Here, Attea defined a check called Check CPU InfluxDB.
“It’ll be set to run every 10 seconds on any node it’s subscribed to,” she explained. The command at the bottom is a simple shell script that will print out CPU usage in InfluxDB Line Protocol. The last two fields on the left indicate that check output metric extraction will occur.
“So the event that is produced contains not only execution context such as status, output, duration, etc.,” said Attea. “There will also be entity information about your monitor node, and lastly – and most importantly – the extracted metric, which is the Kube API server CPU value.”
The entire process is not only easy, said Attea. “It’s magic.”
Integrating a Time Series Database
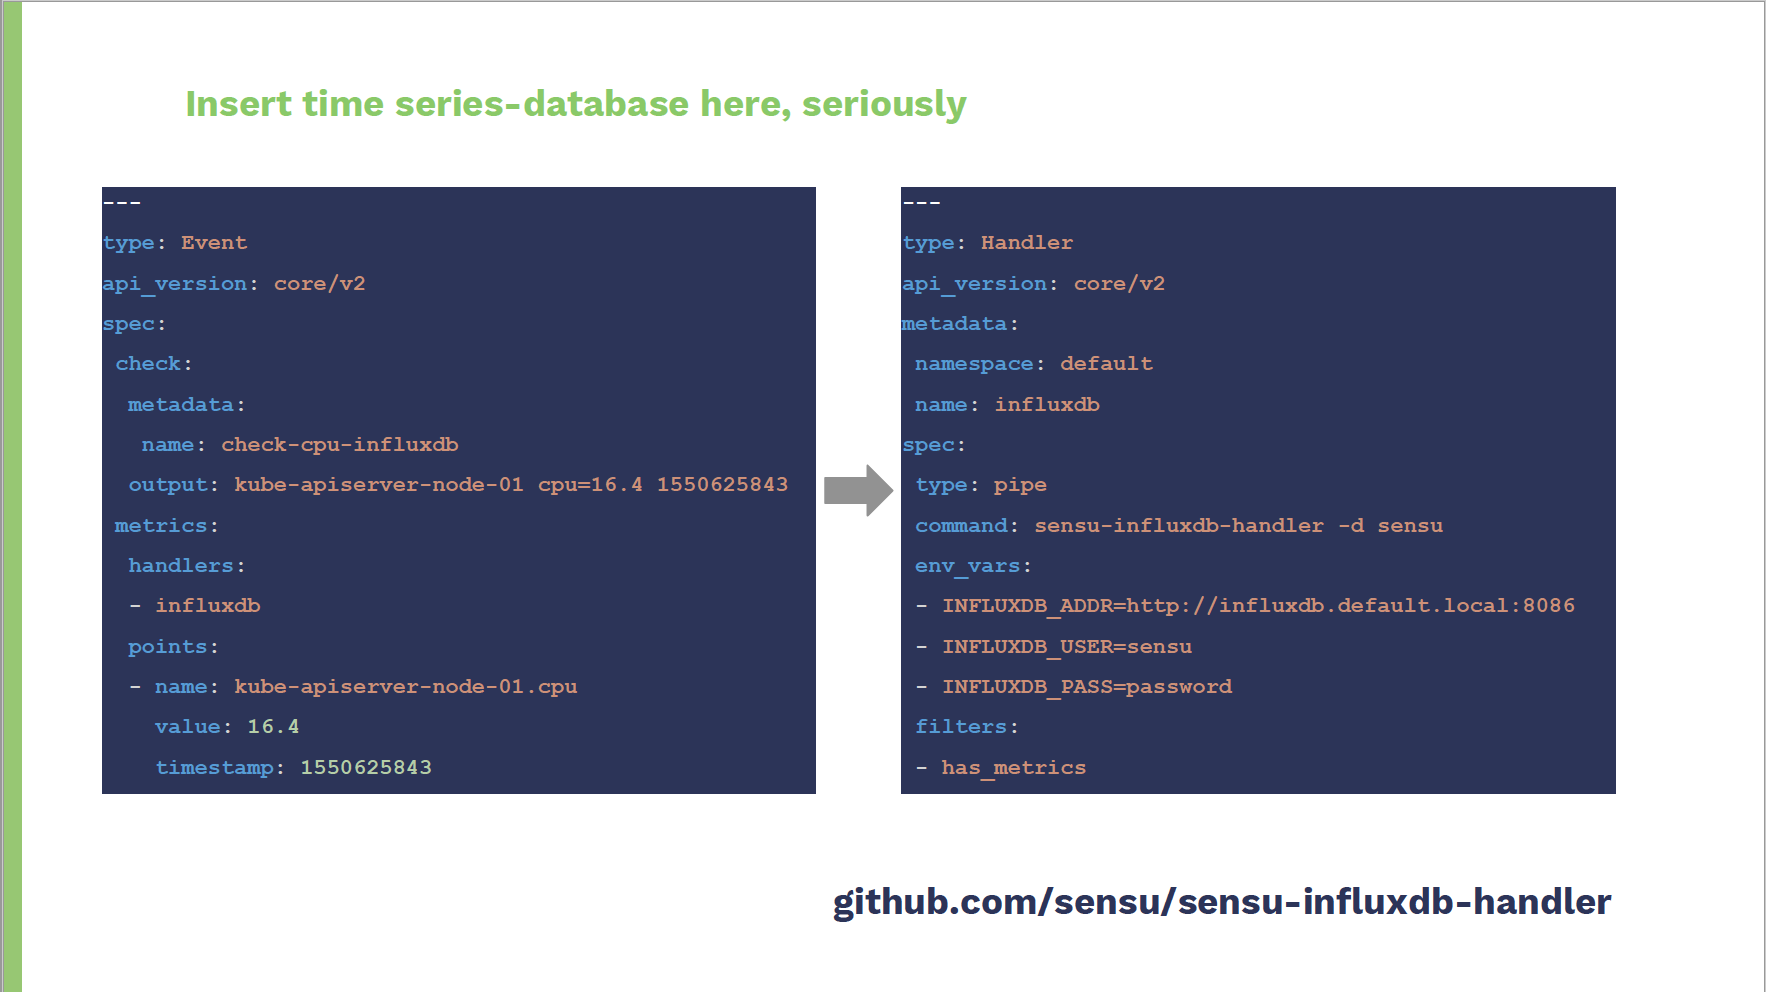
Sensu has tight integrations with many time series databases, so users can simply pick the one they prefer.
In this example, Attea used an InfluxDB handler “because Influx has a super simple Golang client, and Go is my language of choice,” she said.
“The handler configuration on the right takes out event data and invokes the Go binary called Sensu InfluxDB Handler,” Attea explained. “This accepts configuration options as either command line flags or environment variables. And then additional metric tag enrichment can happen as part of the Sensu event pipeline.”
This setup will eventually accept the event data through standard in, and then the metrics will be sent off to the configured time series database.
“This was previously an enterprise feature, so take advantage of it,” advised Attea. Find the source code here.
Inside the Monitoring Event Pipeline
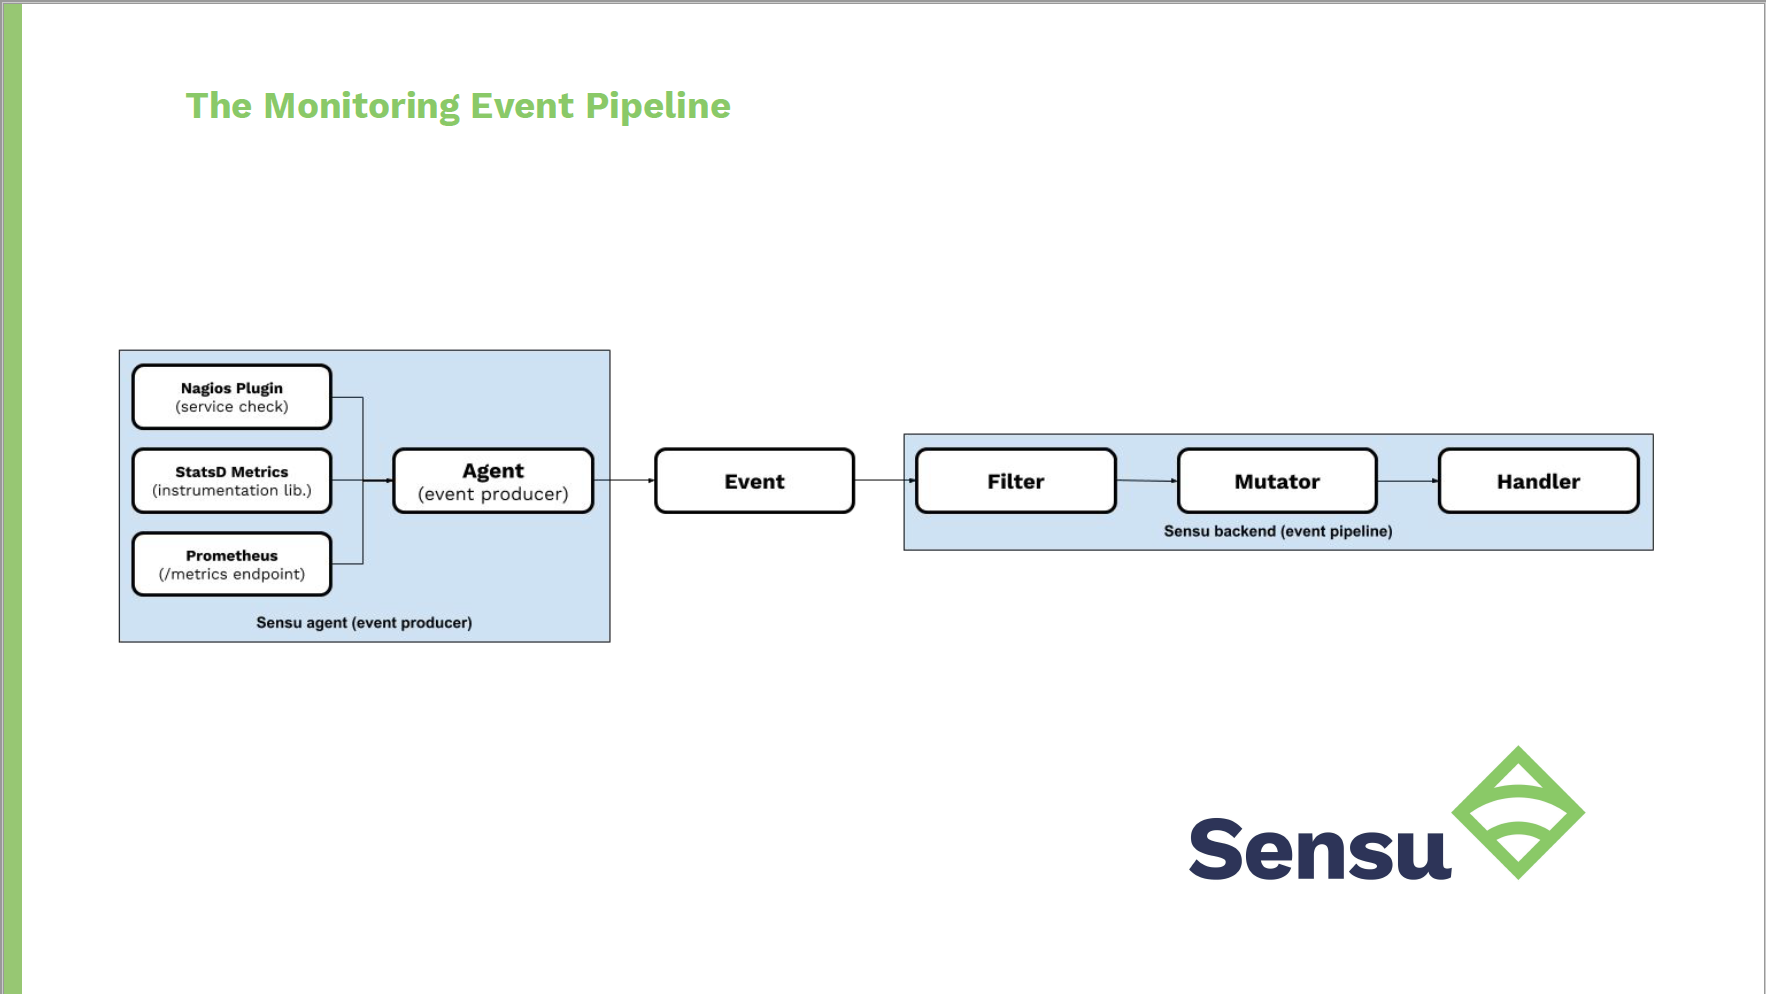
In the event pipeline, the Sensu backend will send service checks to monitor nodes with installed Sensu agents. The agents will execute the check, extract the metrics in any of the four supported formats, and then the backend will receive that event data and pass it through the monitoring event pipeline.
“In this specific use case, you can filter this event only if it contains metrics, mutate that event to enrich any metric tags, and add additional context about the data and source of the metrics. Then you would handle the events by sending them off to a time series database,” said Attea.
This diagram also folds in StatsD metrics as well as another integration with a Prometheus metrics endpoint.
“Essentially any telemetry event that the agent receives will be processed by the backend, which is important because in order to have complete visibility of your app, system, services, infrastructure, you’ll likely have to receive data from multiple sources,” Attea explained. “It’s great that there’s a single entry point for all of this data, but as you start to add different event types like availability and alerts, you’ll be thankful that the pipeline is dynamic enough to support re-usability all under the same hood.”
Visualizing the Data
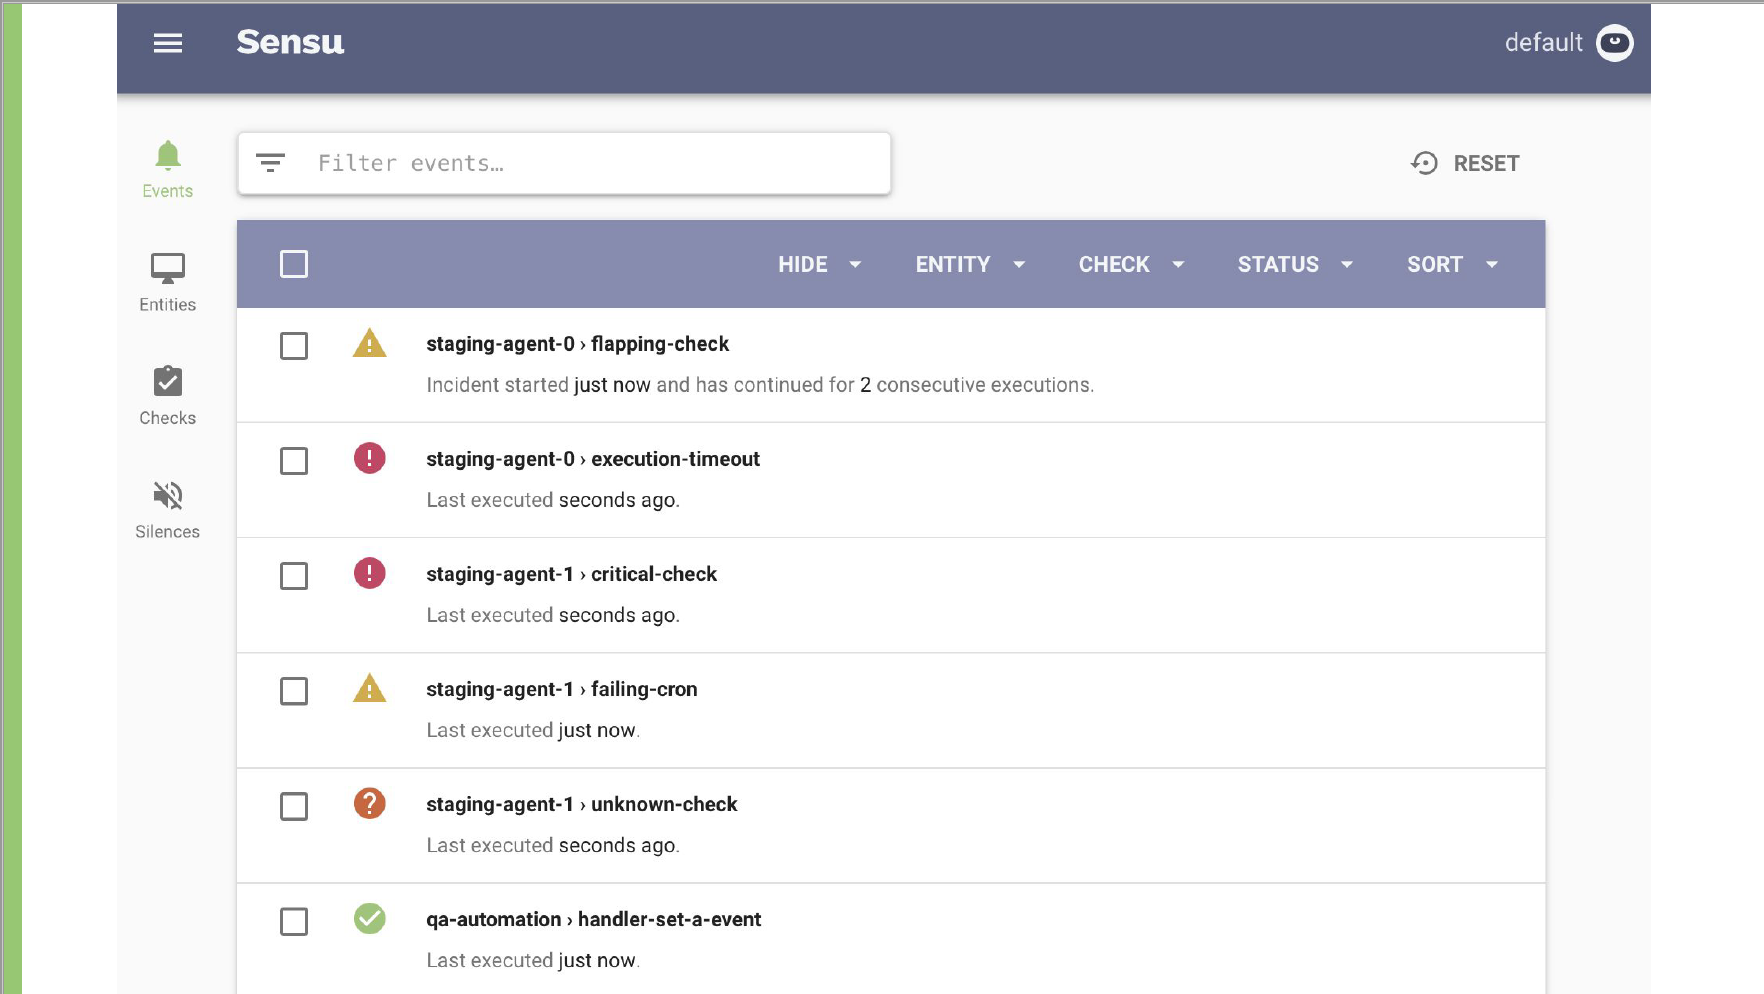
This Sensu dashboard prioritizes critical events over normal statuses. “It’s backend- and API-driven, so while the Sensu dashboard does provide excellent visibility into the overall health of your system and the state, it doesn’t directly visualize time series data,” Attea said.
Enter Grafana.
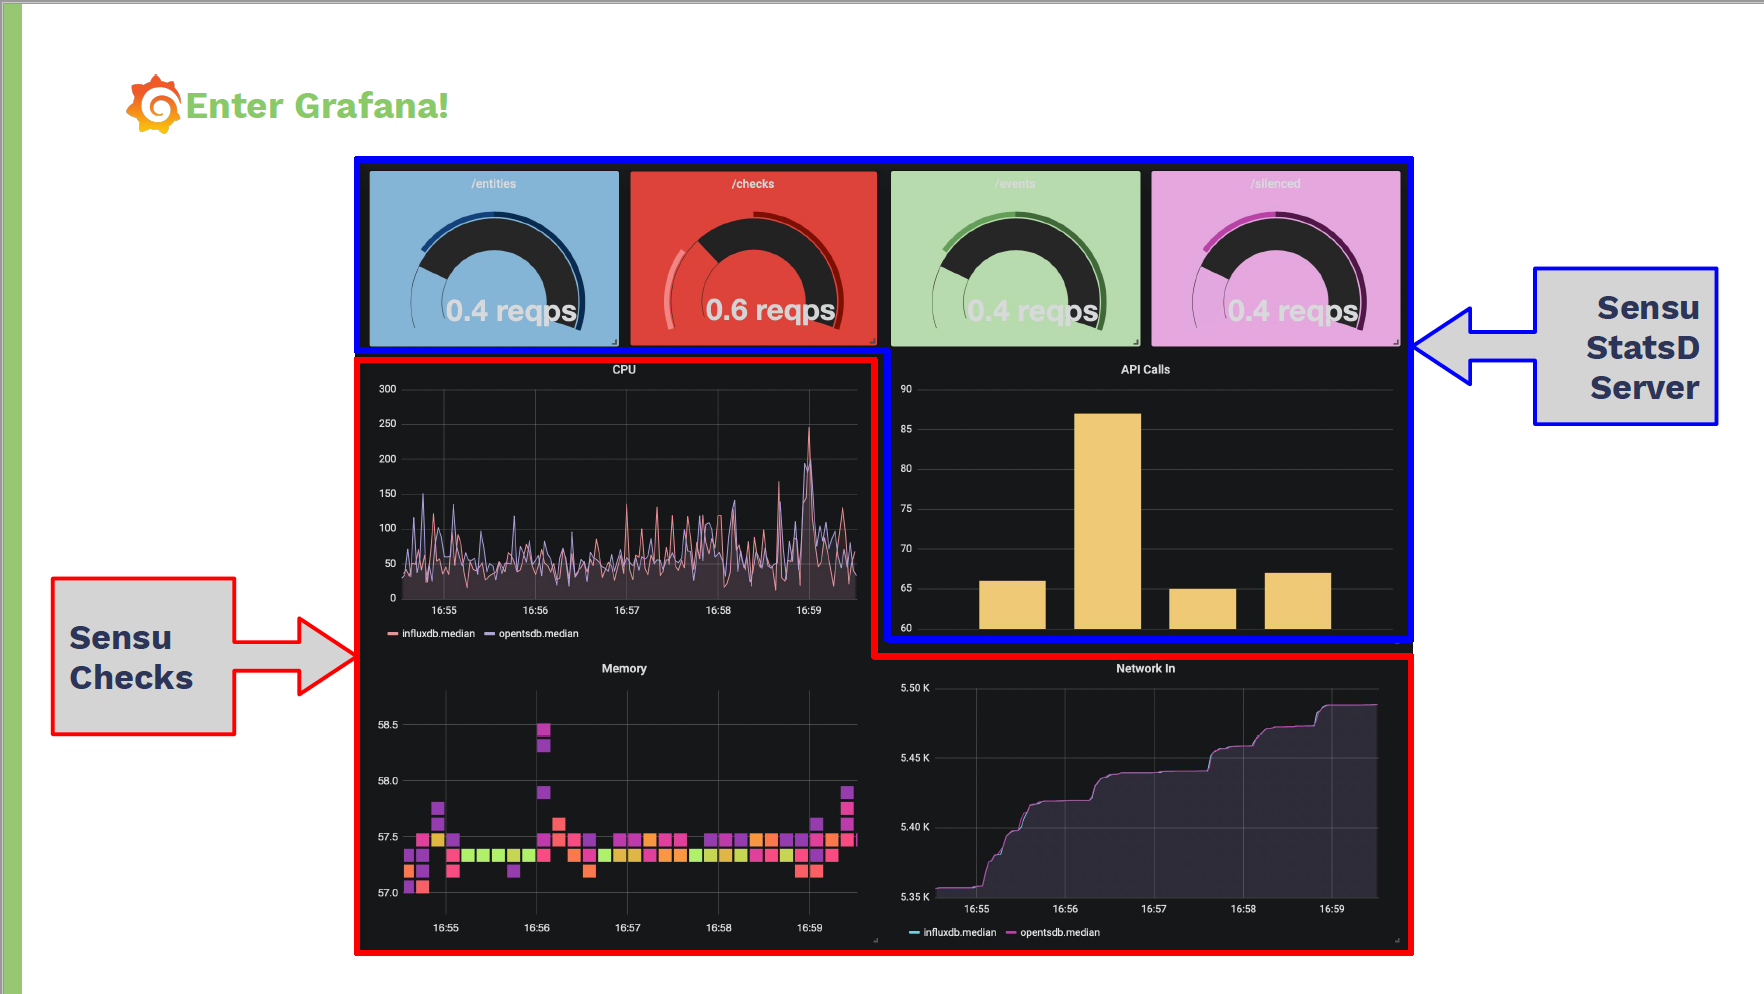
“In this dashboard there’s a single data source as far as Grafana’s concerned, because we let Sensu do all of the heavy lifting,” Attea said. “The Sensu checks shown here are displaying metrics from both Graphite and Influx while the StatsD daemon is tracking all of the API calls and requests rates. … I’d say this dashboard is pretty sleek, so thanks Grafana for making that easy!”
For more from GrafanaCon 2019, check out all the talks on YouTube.
