Plugins 〉Traffic Lights


Traffic Lights


Description
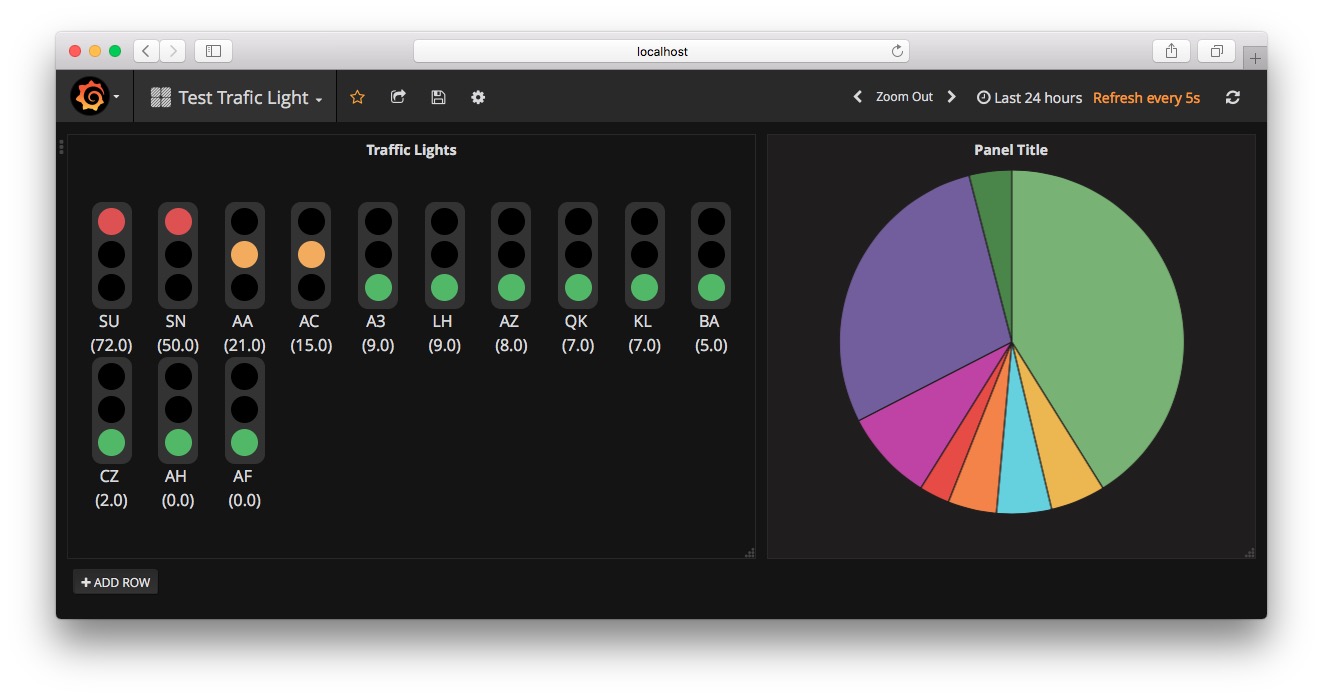
This grafana panel displays traffic lights based on the data source most recent time aggregation. It is possible to tune the thresholds and to limit the number of traffic lights per line. This is the grafana version of the same plugin available for kibana here: https://github.com/snuids/TrafficLightVisKibana5.5
The plugin was tested with Elastic Search 5.5 as data source. The trend is computed between the last and previous date aggregation of the serie.
Installation
Copy the dist folder in your grafana plugin directory and rename it to trafficlight.
Screenshots
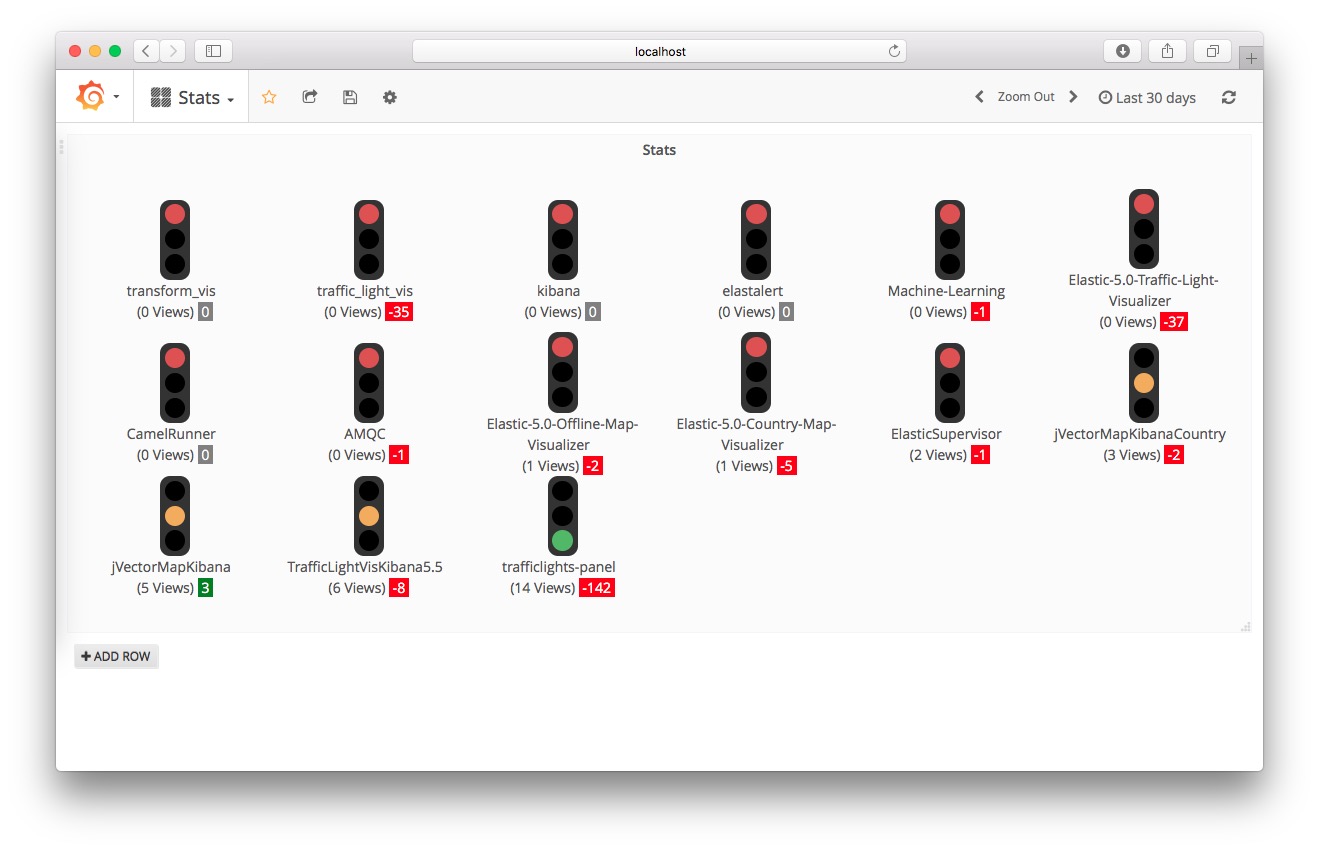
Showcase
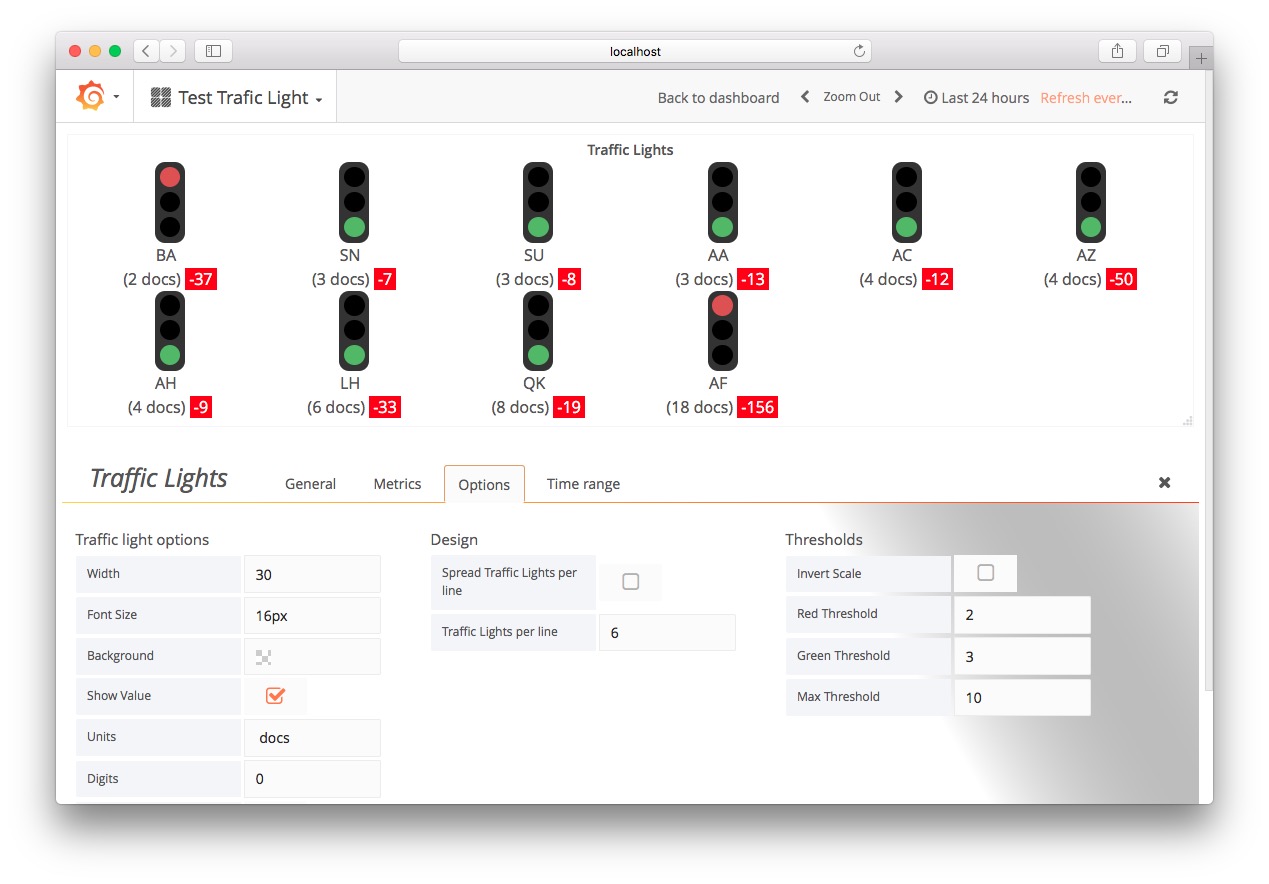
Metrics Configuration

Panel Options
Versions
v0.1.2 (13/Oct/2017)
- Added Units and Digits options
- Added Trend options
- Do no longer crash if there is no date histogram aggregation
v1.1.0 (19/Oct/2017)
- Versions synchronized
v1.2.0 (27/Oct/2017)
- Panel id renamed to snuids-traffic-lights (Edit your panels plugin id when upgrading from 1.1.0)
v1.3.0 (28/Oct/2017)
- Threshold validations added
- Options number fields are now number fields. (Text in previous versions)
v1.4.0 (01/Nov/2017)
- Options tab hints added
v1.4.1 (21/Jun/2018)
- Plugin id renamed to match grafana guidelines
v1.4.2 (21/Jun/2018)
- Fix the editor path
v1.4.4 (09/Aug/2018)
- Sort by name option added
v1.4.5 (16/Oct/2018)
- Added option to add link to the traffic light (Raul Melo)
- Clean some dev console logs (Raul Melo)
V1.4.6 (27/Mai/2019)
- Added color picker for metric name color
V1.4.7 (17/Sep/2020)
- Image renderer support
- Grafana 7 compatibility
V1.5.0 (10/Nov/2021)
- Turn light off if metric value equal noValueNumber setting
V1.5.1 (11/Jan/2022)
- Plugin signed
V1.5.2 (19/Feb/2023)
- Retry to publish on grafana
V1.6.0 (04/Mar/2023)
- Added the option to color the traffic light via the trend (last - (previous))
- Added a serie name transformation option
Grafana Cloud Free
- Free tier: Limited to 3 users
- Paid plans: $55 / user / month above included usage
- Access to all Enterprise Plugins
- Fully managed service (not available to self-manage)
Self-hosted Grafana Enterprise
- Access to all Enterprise plugins
- All Grafana Enterprise features
- Self-manage on your own infrastructure
Install on Grafana Cloud
Plugins can be installed directly from within your Grafana instance or automated using the Cloud API or Terraform.
Learn more about plugin installationMarketplace plugins
This is a paid plugin developed by a marketplace partner. To purchase an entitlement, sign in first, then fill out the contact form.
Get this plugin
This is a paid for plugin developed by a marketplace partner. To purchase entitlement please fill out the contact us form.
What to expect:
- Grafana Labs will reach out to discuss your needs
- Payment will be taken by Grafana Labs
- Once purchased the plugin will be available for you to install (cloud) or a signed version will be provided (on-premise)
Thank you! We will be in touch.
For more information, visit the docs on plugin installation.
Installing on a local Grafana:
For local instances, plugins are installed and updated via a simple CLI command. Plugins are not updated automatically, however you will be notified when updates are available right within your Grafana.
1. Install the Panel
Use the grafana-cli tool to install Traffic Lights from the commandline:
grafana-cli plugins install The plugin will be installed into your grafana plugins directory; the default is /var/lib/grafana/plugins. More information on the cli tool.
Alternatively, you can manually download the .zip file for your architecture below and unpack it into your grafana plugins directory.
Alternatively, you can manually download the .zip file and unpack it into your grafana plugins directory.
2. Add the Panel to a Dashboard
Installed panels are available immediately in the Dashboards section in your Grafana main menu, and can be added like any other core panel in Grafana.
To see a list of installed panels, click the Plugins item in the main menu. Both core panels and installed panels will appear.