Plugins 〉Debug


Panel
grafana
Marketplace
Debug
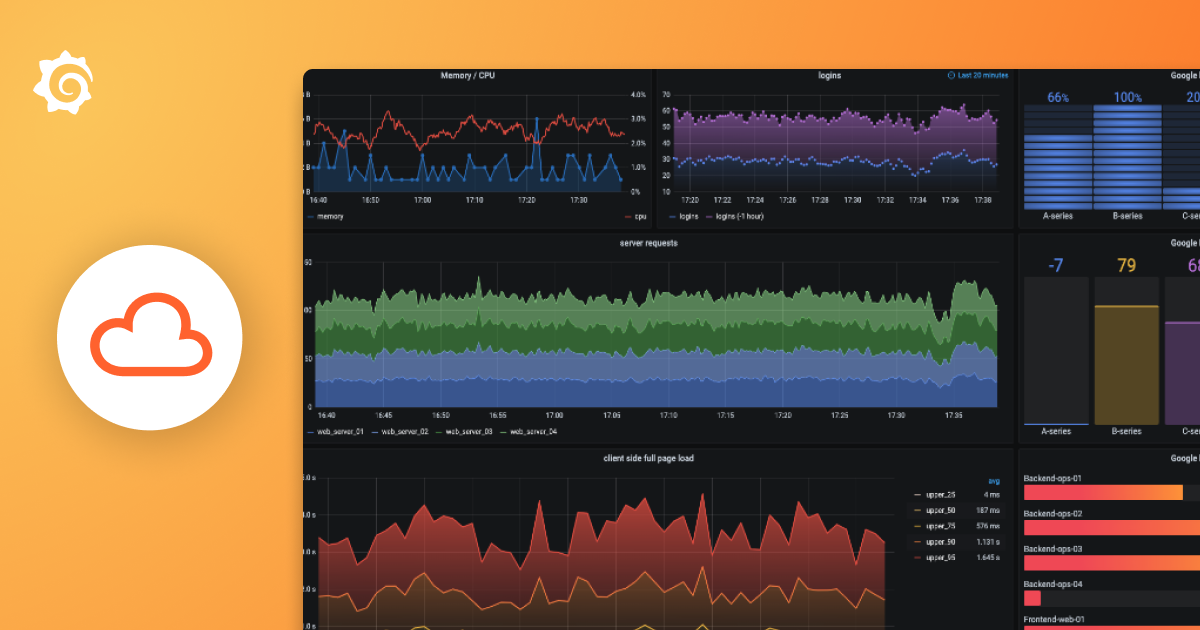
Debug Panel - Native Plugin
The Debug Panel is included with Grafana.
This panel shows render information helpful in debugging query execution and panel rendering performance.
This plugin is included with Grafana and does not require installation. Woo.
Docs
Customize navigation placement of plugin pages
Docs
Install a plugin
Docs
Isolate plugin code with the Plugin Frontend Sandbox
Docs
Plugin backend communication
Docs
Plugin signatures
Docs
Types of plugins
Docs
Install plugins in Grafana Cloud using Terraform
Docs
Image rendering flags
Docs
Troubleshoot image rendering
Blog
Video: How to get started with MongoDB and Grafana
Blog
Monitoring COVID-19 virus levels in wastewater using Grafana, Databricks, and the Sqlyze plugin
Blog
Video: Top 3 features of the New Relic data source plugin for Grafana Enterprise
Blog
How traceroute in the Synthetic Monitoring plugin for Grafana Cloud helps network troubleshooting
Blog
Video: How to build a Prometheus query in Grafana
Blog
Video: How to set up a Prometheus data source in Grafana