Plugins 〉Cognite Data Fusion
Cognite Data Fusion
Cognite Data Source for Grafana
Grafana datasource for Cognite Data Fusion.
Features
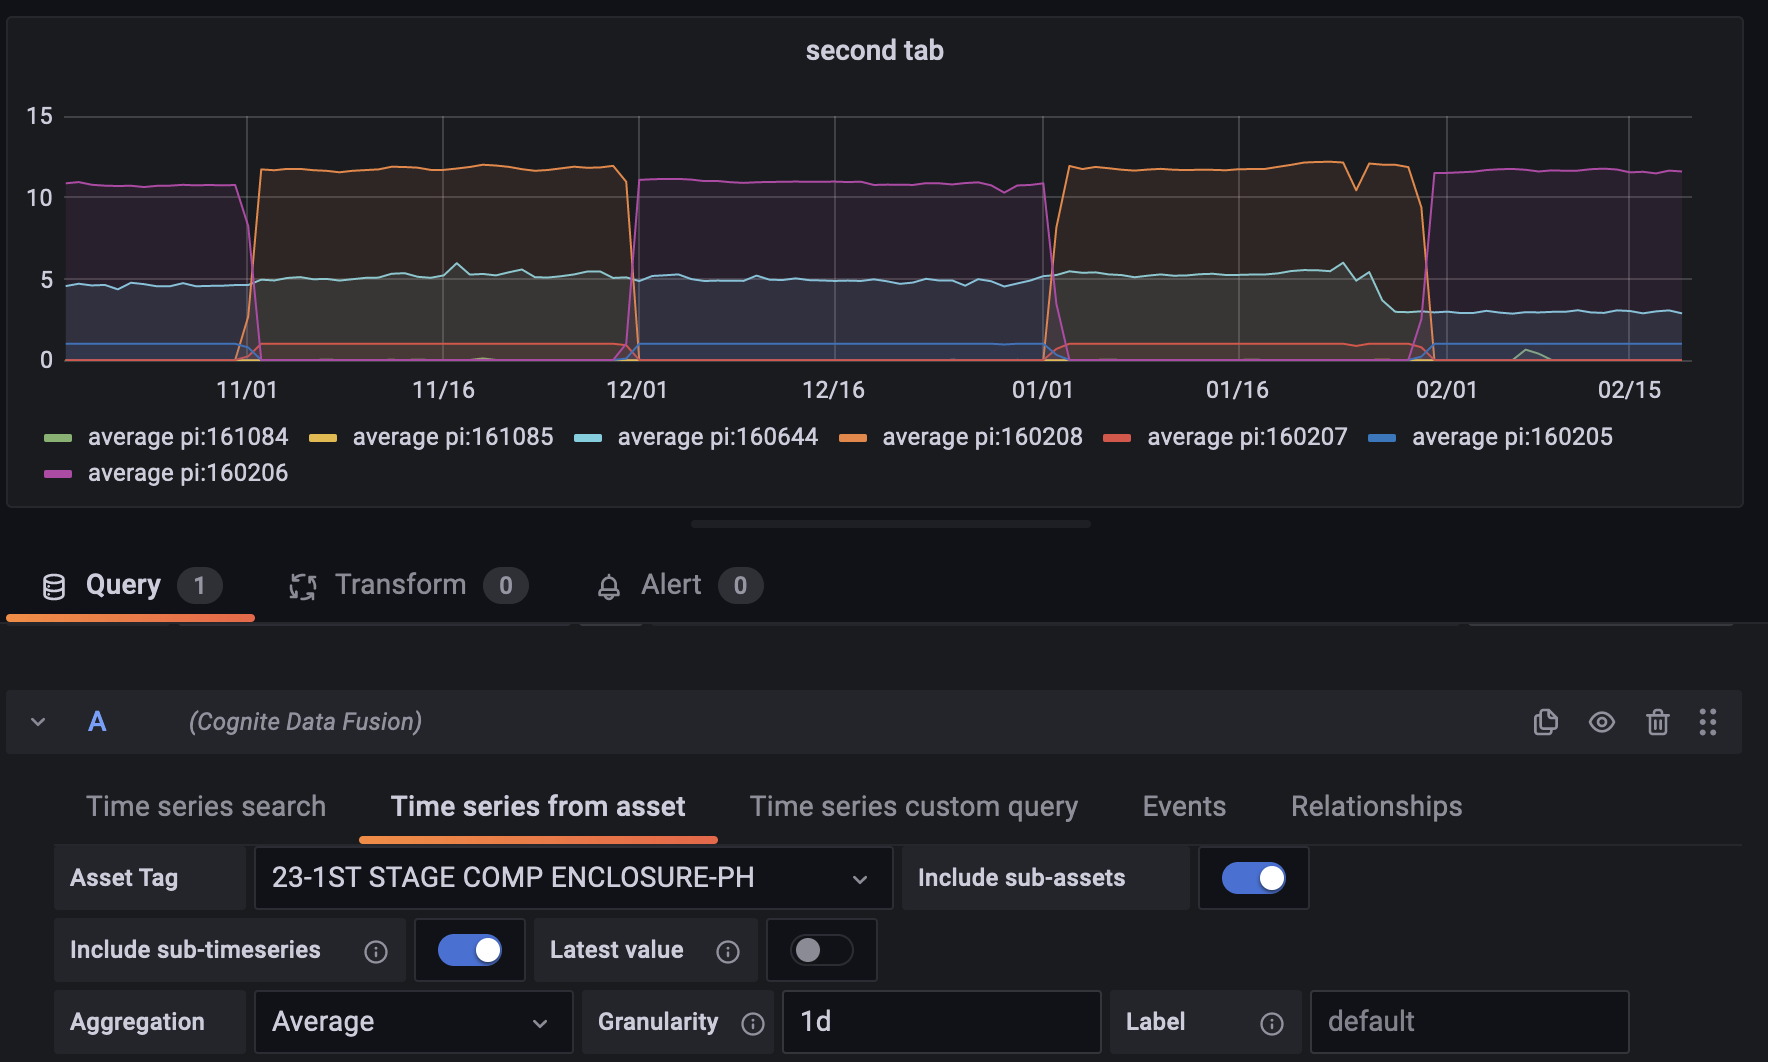
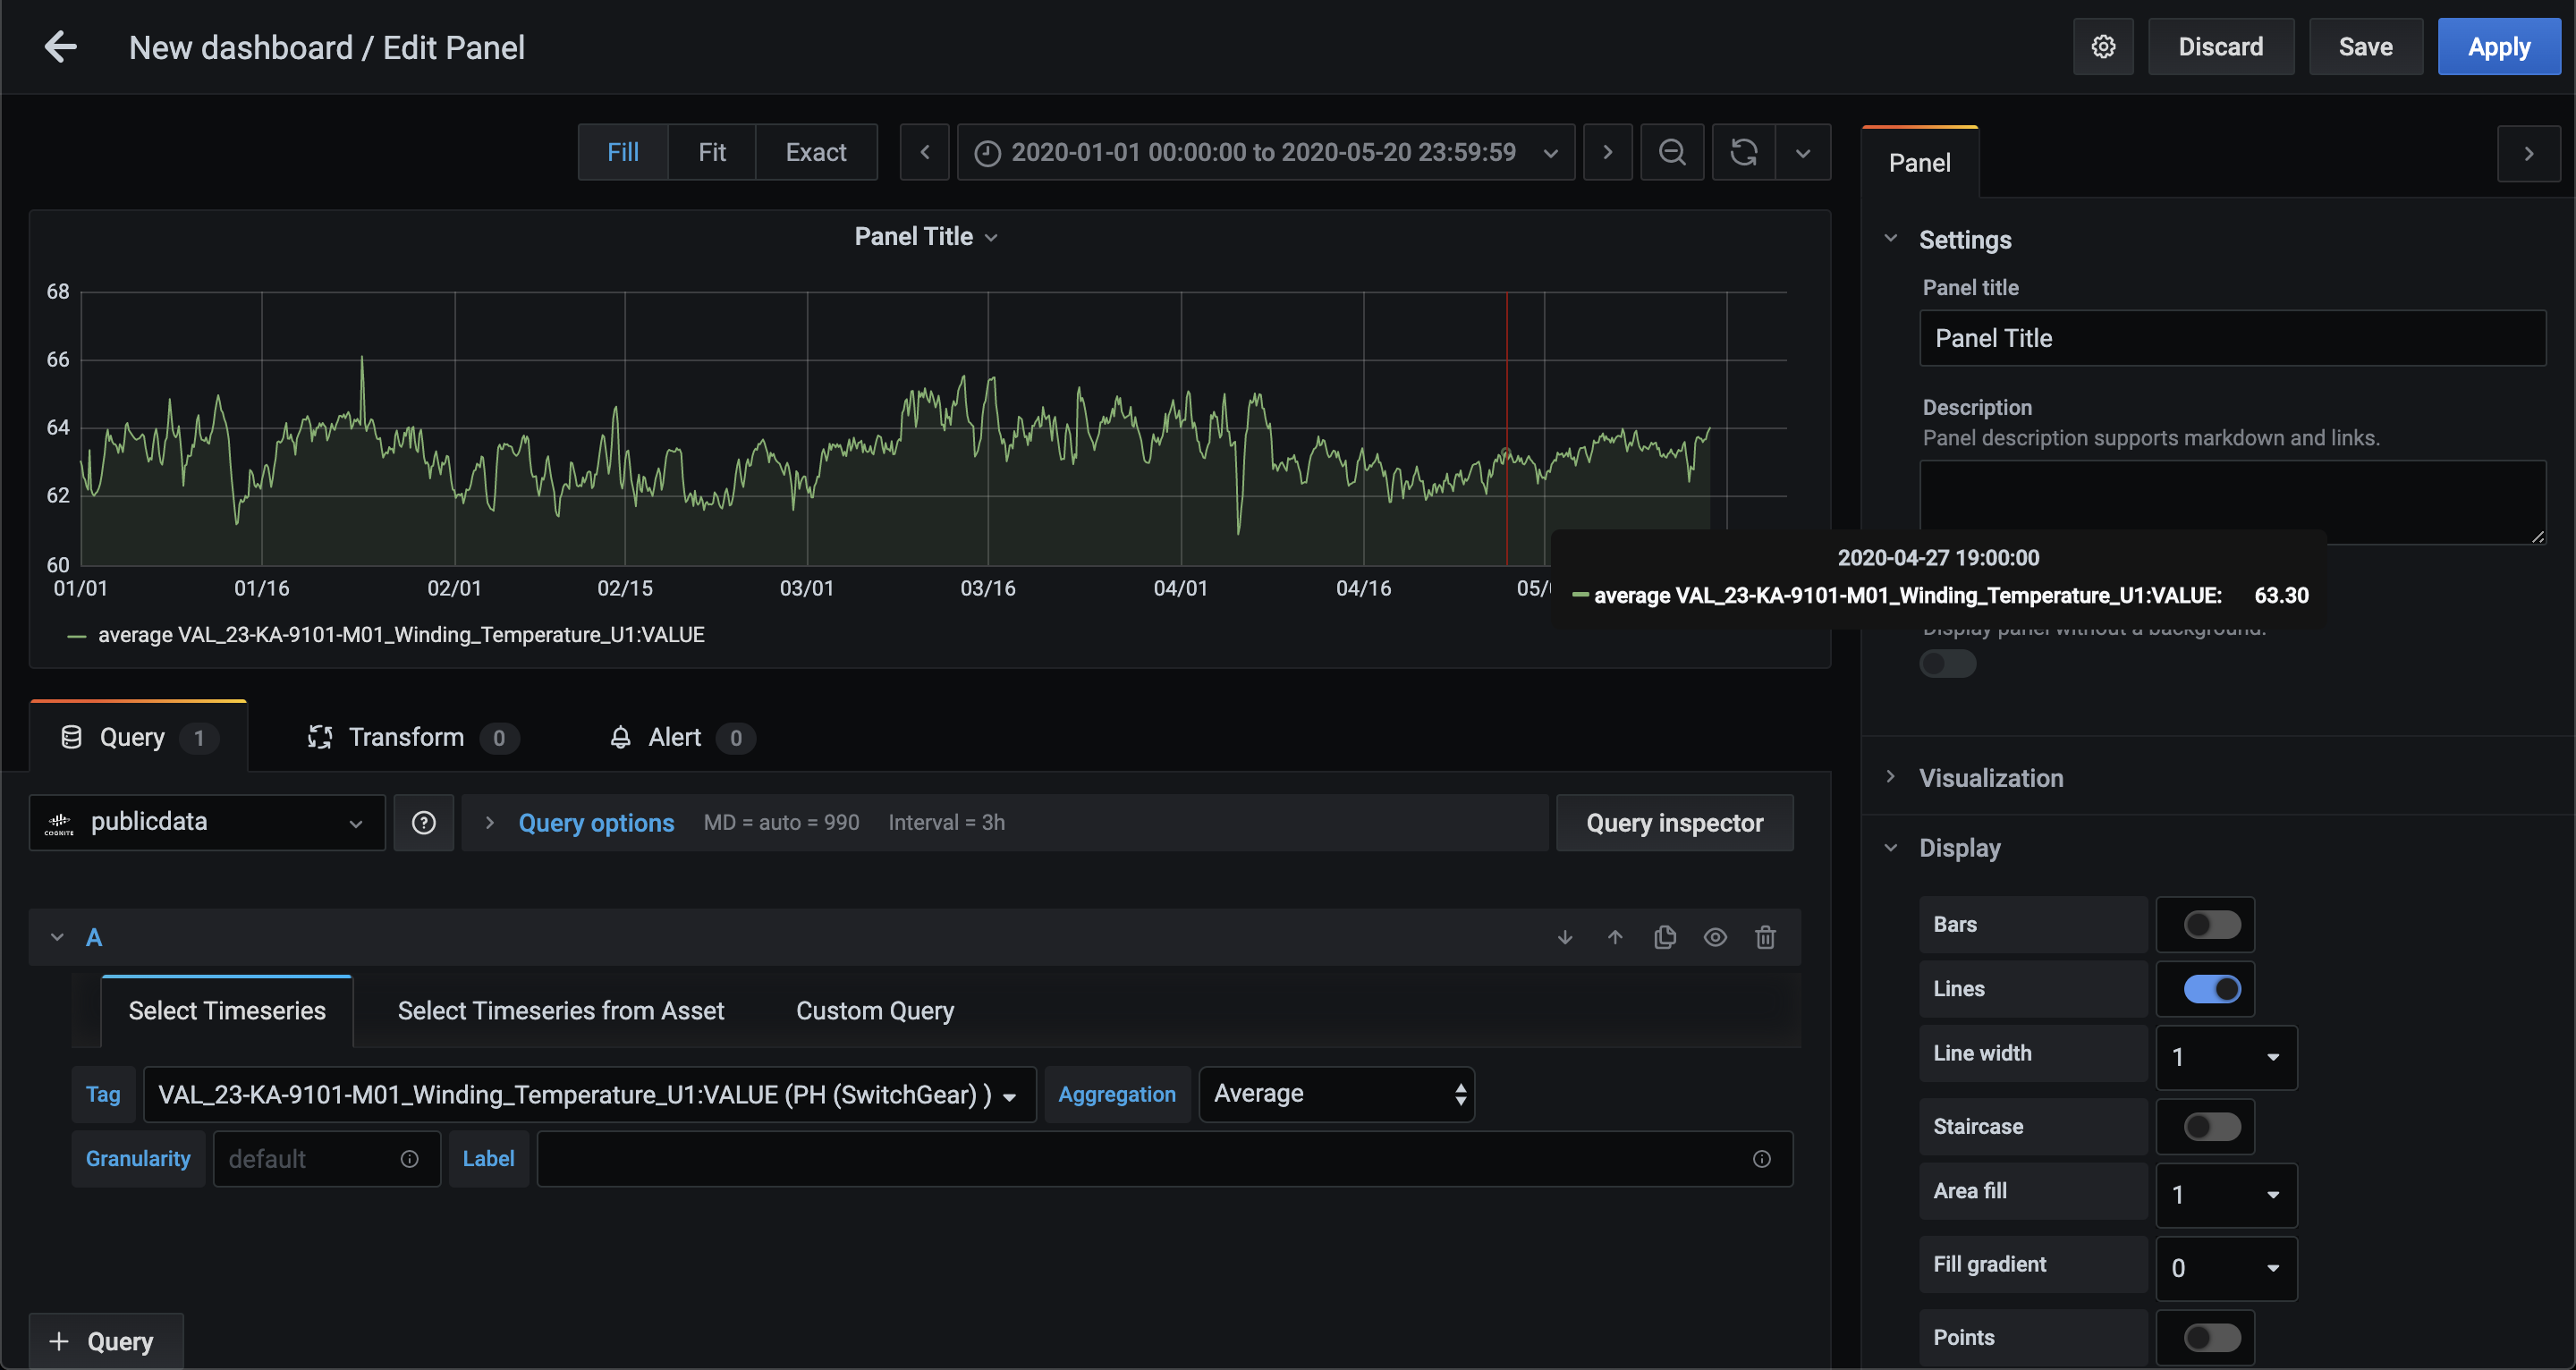
- Easily create graphs with timeseries from Cognite Data Fusion
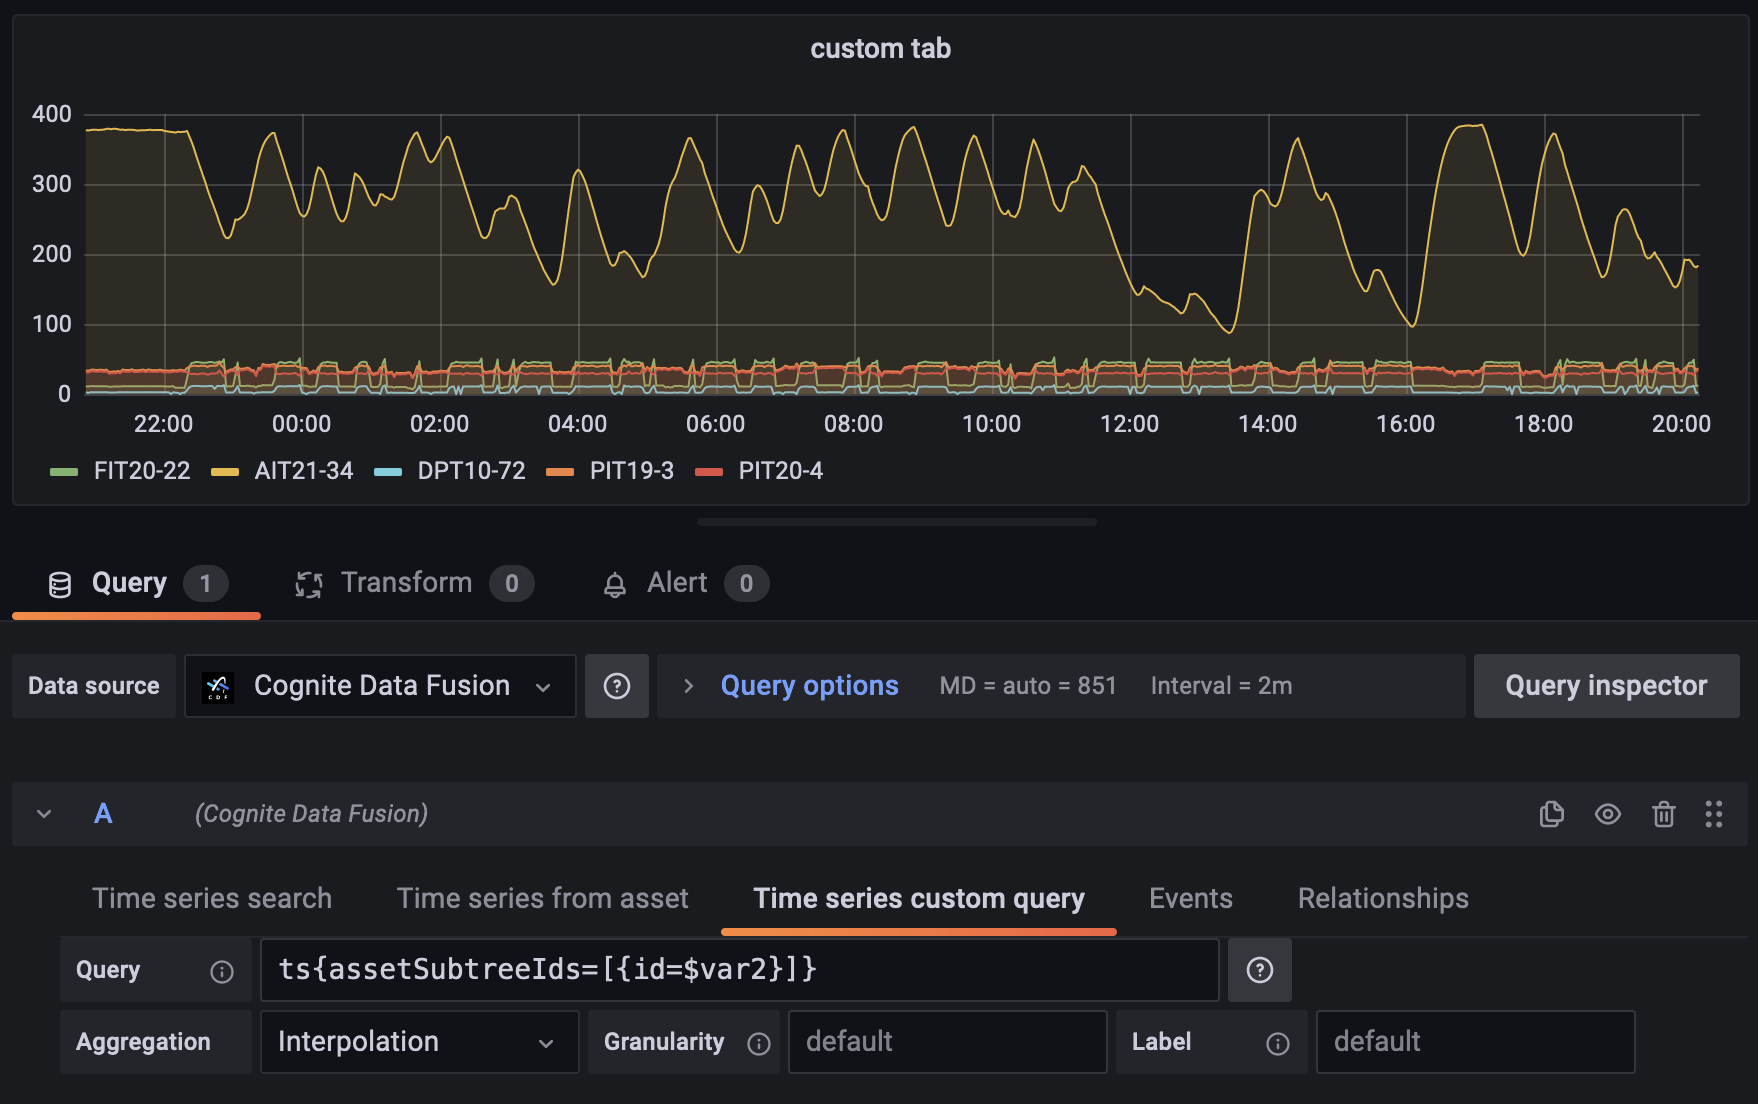
- Perform custom queries to filter for specific timeseries
- Use variables to create templated dashboards
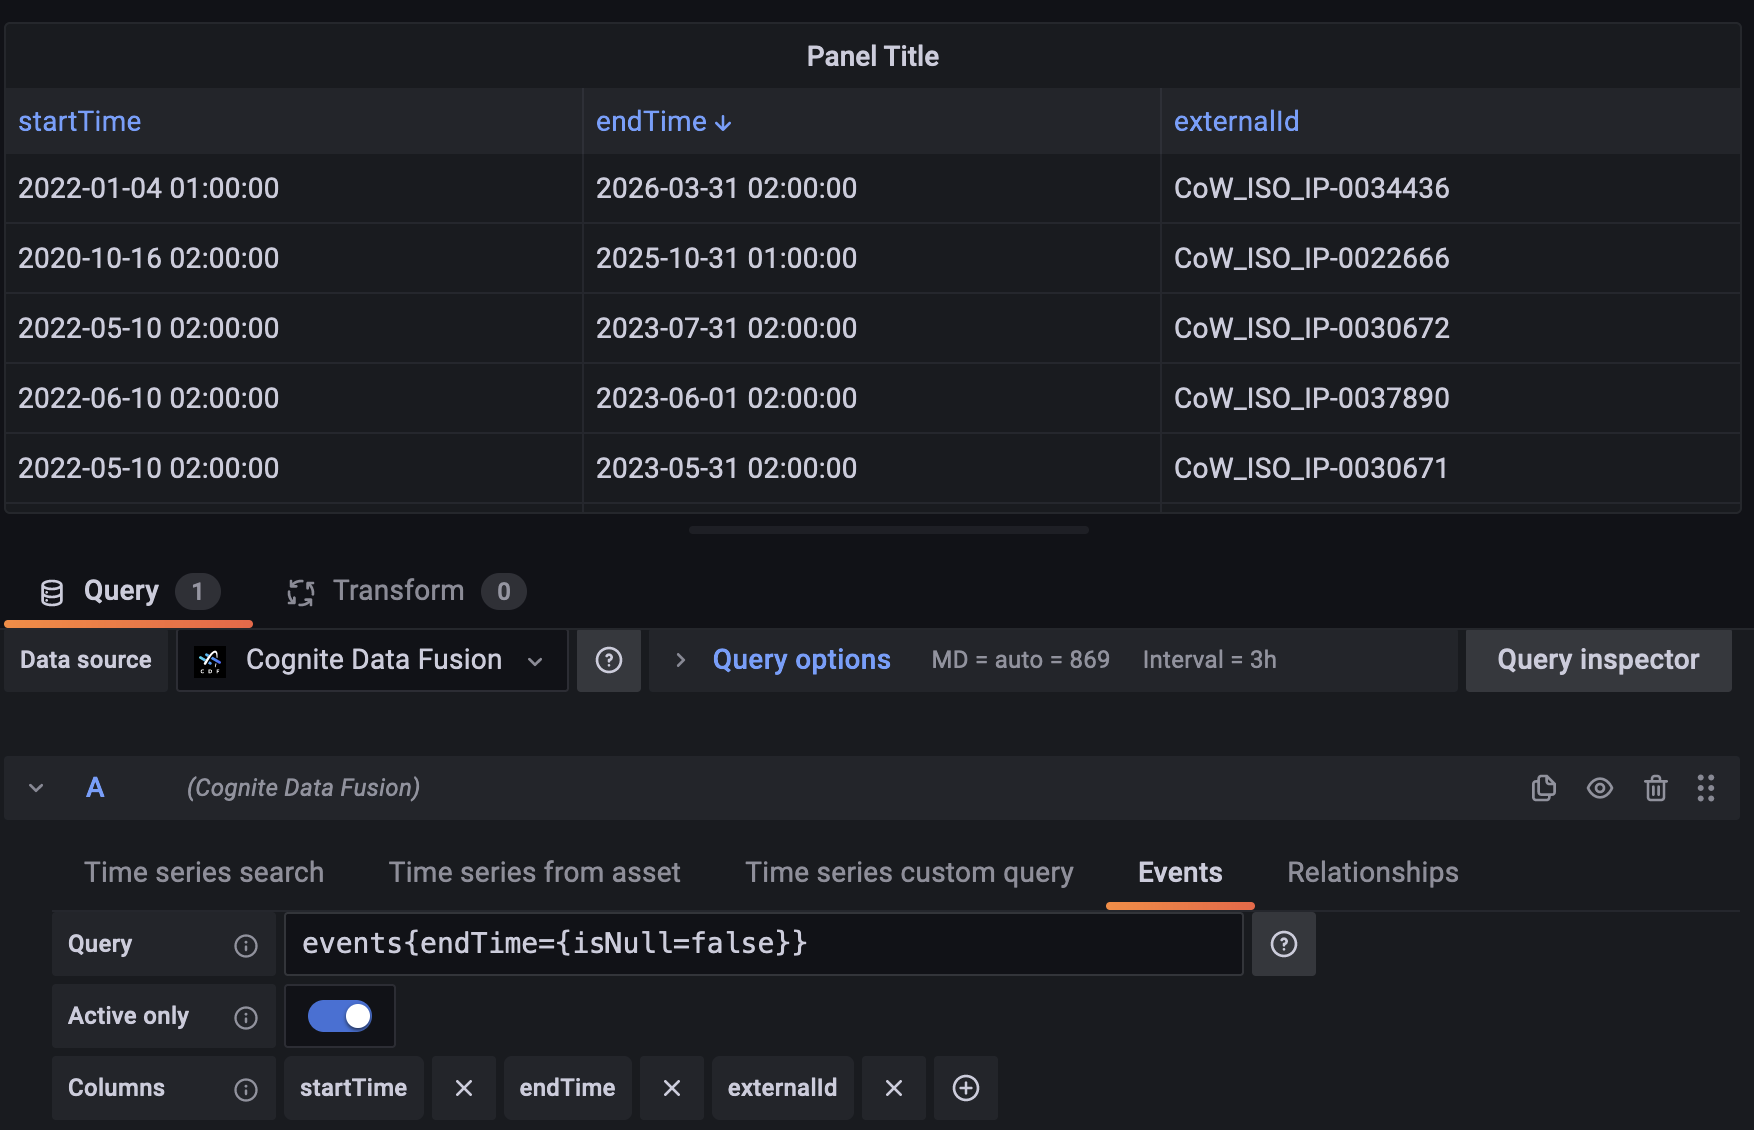
- Add event annotations to graphs
- Apply custom functions to timeseries
Installation
The easiest way to install this plugin is to follow the installation instructions on this page.
Documentation
To learn more about the connector please visit our documentation.
Feedback
If you find any bugs, or have any suggestions, please visit support portal.
Development
See here.
Grafana Cloud Free
- Free tier: Limited to 3 users
- Paid plans: $55 / user / month above included usage
- Access to all Enterprise Plugins
- Fully managed service (not available to self-manage)
Self-hosted Grafana Enterprise
- Access to all Enterprise plugins
- All Grafana Enterprise features
- Self-manage on your own infrastructure
Installing Cognite Data Fusion on Grafana Cloud:
Installing plugins on a Grafana Cloud instance is a one-click install; same with updates. Cool, right?
Note that it could take up to 1 minute to see the plugin show up in your Grafana.
Warning
Plugin installation from this page will be removed in February 2026. Use the Plugin Catalog in your Grafana instance instead. Refer to Install a plugin in the Grafana documentation for more information.
Installing plugins on a Grafana Cloud instance is a one-click install; same with updates. Cool, right?
Note that it could take up to 1 minute to see the plugin show up in your Grafana.
Installing plugins on a Grafana Cloud instance is a one-click install; same with updates. Cool, right?
Note that it could take up to 1 minute to see the plugin show up in your Grafana.
Warning
Plugin installation from this page will be removed in February 2026. Use the Plugin Catalog in your Grafana instance instead. Refer to Install a plugin in the Grafana documentation for more information.
Installing plugins on a Grafana Cloud instance is a one-click install; same with updates. Cool, right?
Note that it could take up to 1 minute to see the plugin show up in your Grafana.
Marketplace plugins
This is a paid plugin developed by a marketplace partner. To purchase an entitlement, sign in first, then fill out the contact form.
Get this plugin
This is a paid for plugin developed by a marketplace partner. To purchase entitlement please fill out the contact us form.
What to expect:
- Grafana Labs will reach out to discuss your needs
- Payment will be taken by Grafana Labs
- Once purchased the plugin will be available for you to install (cloud) or a signed version will be provided (on-premise)
Thank you! We will be in touch.
For more information, visit the docs on plugin installation.
Installing on a local Grafana:
For local instances, plugins are installed and updated via a simple CLI command. Plugins are not updated automatically, however you will be notified when updates are available right within your Grafana.
1. Install the Data Source
Use the grafana-cli tool to install Cognite Data Fusion from the commandline:
grafana-cli plugins install The plugin will be installed into your grafana plugins directory; the default is /var/lib/grafana/plugins. More information on the cli tool.
Alternatively, you can manually download the .zip file for your architecture below and unpack it into your grafana plugins directory.
Alternatively, you can manually download the .zip file and unpack it into your grafana plugins directory.
2. Configure the Data Source
Accessed from the Grafana main menu, newly installed data sources can be added immediately within the Data Sources section.
Next, click the Add data source button in the upper right. The data source will be available for selection in the Type select box.
To see a list of installed data sources, click the Plugins item in the main menu. Both core data sources and installed data sources will appear.
Releases
This article documents the ongoing improvements we're making to the Cognite Data Source for Grafana.
4.5.0 - April 27th, 2026
Features
- Added Activities query editor tab for querying CogniteActivity records by resource type (Asset, Equipment, TimeSeries)
- Added CogniteActivity annotations overlay on CogniteTimeSeries charts, displayed as shaded regions with start/end times
- Added automatic numeric time series detection in the Data Models (GraphQL) tab, auto-triggering the CDF datapoints API for matching results
- Overhauled datasource config editor: reorganized into Connection and Features tabs, CDM features now enabled by default for new datasources, CDM and asset-centric (legacy) toggles are mutually exclusive
- Base URL field now strips
http(s)://prefixes and trailing slashes automatically to prevent misconfigured proxy URLs - Query editor dropdowns (CDM Time Series and Activities) now load options lazily on menu open
- Relationships feature is now off by default for new datasources
Bug fixes
- Fixed broken Cognite documentation URLs in annotations editor, query help, variable query editor, and shared constants
- Improved UX copy and tooltip text across config editor and query editors for clarity and consistency
Security
- Updated lodash to v4.18.1 to address CVE-2025-13465
- Updated webpack to v5.104.1 to address CVE-2025-68458
4.4.0 - November 12th, 2025
Features
- Added CogniteTimeSeries Search Tab for improved time series discovery and selection
- Reorganized feature flags UI with master toggles and improved query editor experience
- Added GraphQL variables support with tabbed interface for enhanced data model querying capabilities
Bug fixes
- Updated plugin dependencies to address security vulnerabilities and compatibility issues
4.3.0 - April 24th, 2025
Features
- Updated plugin GUI components to accomodate for Grafana v12 changes
- Preliminary work to enable backend data source in the future
Bug fixes
- Upgraded plugin dependencies
4.2.1 - November 28th, 2024
Bug fixes
- Upgrade plugin dependencies to fix CVEs
4.2.0 - June 17th, 2024
Features
- Adds time zone support for aggregated time series, the user can select the timezone using the Grafana time range options.
4.1.3 - May 7th, 2024
Bug fixes
- Fixed performance issue with parser which occurs when a fairly long custom time series query is used.
4.1.2 - March 14th, 2024
Bug fixes
- Fixed an issue with Events resource timestamp columns where it was previously displayed in epoch format and now it is displayed in human-readable format
4.1.1 - February 14th, 2024
Bug fixes
- Fixed an issue with the custom query where floats with more than 7 digits after the decimal point were causing syntax error
4.1.0 - February 7th, 2024
Features
- Added new time series property
unitExternalId - Added support to filter time series by
unitExternalIdandunitQuantityin custom queries - Added support to query data points with unit conversion in custom queries
- Small UI improvement to the query field in the custom query tab
Bug fixes
- Patched plugin dependencies to fix deprecation errors
4.0.1 - November 7th, 2023
Bug fixes
- Patched regressions introduced after the migration to React:
- Events table
activeAtTimefilter is now working as before - Annotations filters are applied correctly as before
- Added back hints and examples for annotation query
- Events table
- Multiple dependencies have been updated to fix security vulnerabilities
4.0.0 - October 12th, 2023
Features
- Migrate Annotation editor from Angular to React
- Bumped minimum Grafana version requirement to v10
- Events are returned in dataframe format
3.1.0 - May 10th, 2023
Features
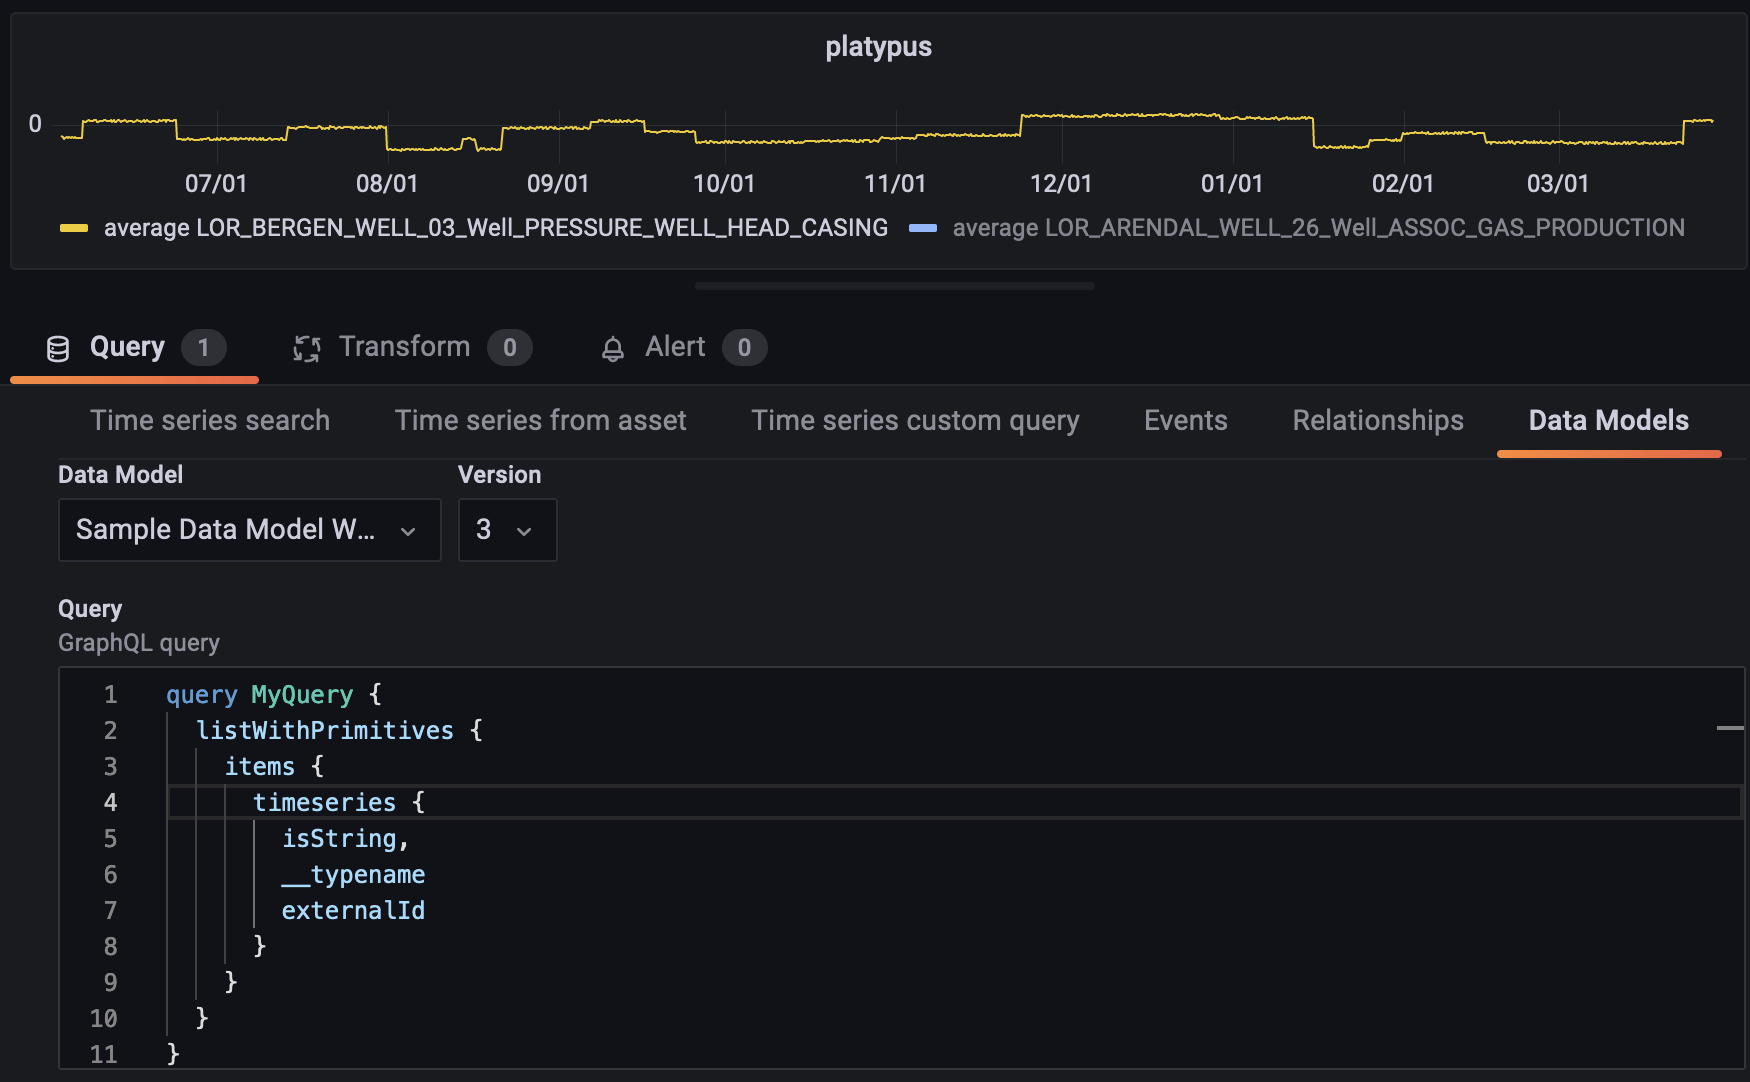
- Added support for the new version of CDF Data Models (GraphQL)
- Added an option to sort Events table
3.0.1 - April 3rd, 2023
- Patched plugin dependencies
- Fixed the wording for the CDF host paramether in the plugin configuration
3.0.0 - November 21st, 2022
- The connector dependencies has been updated and the connector now requires Grafana v8 or later.
- Flexible Data Modelling is now added as a preview feature. You need enable it on the data source settings. The plugin will visualize tables and time series which has been modelled in Cognite's new Flexible Data Model
- Extraction Pipelines is added as a preview feature. You can now see the latest status of your extraction pipelines and runs inside Grafana.
- Advanced filtering of events now also supports aggregates.
- Variables created with an asset-query can now return
externalIdandnameas value in addition toid. This is useful when using a variable inside FDM graphQl query.
2.6.0 - August 4th, 2022
Kubernetes grafana operator support
- The connector now supports being used with the Kubernetes
Grafana operator as
the
GrafanaDataSource CRD.
In the operator you specify the Cognite project in
defaultProjectparameter and the API URL as theclusterUrlparameter. In the operator you can specify a data source using the syntax below:
datasources:
  - access: proxy
    editable: false
    isDefault: true
    jsonData:
      clusterUrl: westeurope-1.cognitedata.com # other examples are api.cognitedata.com, az-eastus-1.cognitedata.com etc
      defaultProject: <cdf-project>
      oauthPassThru: true
    name: CDF
    type: cognitedata-datasource
name: cdf.yaml
Advanced filter support for events (alpha)
- Advanced filtering support for events have been added as separate input box in the events tab. Enable this in the data source settings.
- API documentation
Relationships updates
- All drop downs in the relationships tab are now sorted and searchable
2.5.0 - June 1, 2022
Relationships support
- The connector now supports the CDF relationships resource type. Read more about relationships at Relationships documentation.
- With relationships support you can now fetch time series based on relationships in the "Time series from asset" tab. Relationships can be filtered on data set, labels and active relationships based on the time filter selected in Grafana.
- A new relationships tab has been added which can be used to utilize Grafana's Node Graph visualization plugin, or a new (alpha) custom visualization plugin which can be found at cognite-grafana-relationships-visualization
Templates support (preview)
- A new templates tab has been added which support the CDF templates feature (preview). Enable this in the data source settings.
- Using templates with Grafana will allow you to dynamically scale your dashboards when adding equipment.
- Documentation: https://docs.cognite.com/dev/concepts/resource_types/templates
2.4.0 - August 20, 2021
Features
- OAuth 2.0 client credentials grant flow to authenticate and authorize against CDF.
2.3.0 - June 1, 2021
Features
- Ability to link variables so that the value of one variable can be used as an input to another.
2.2.0 - April 6, 2021
Features
- Tabular representation of events data.
- Event annotation query shows unfinished events by default.
- Support for OAuth authentication with CDF.
- Option to fetch only the latest data point for the time series.
2.1.1 - November 23, 2020
Bug fixes:
- Support variables in
time series by assetquery. In version 2.1.0$variableused as anAsset tagworked for earlier created dashboards, but it was impossible to create a new panel with the same capability.
2.1.0 - November 19, 2020
- The data source requires Grafana version
7.0.6or above. - Time series are now saved to dashboards by their
externalIdwhere possible. This allows you to switch between CDF projects that contain time series with matchingexternalIds. - Support for synthetic time series alignment.
- Rewrote data source GUI to React.
- Updated CDF logo to match light/dark theme.
2.0.1 - August 25, 2020
Bug fixes:
[Custom query] Option to display legend label as a plain text instead of expression
Example for query:
ts{id=1} + ts{id=2} + 1:- User label
custom nameresults incustom namelabel. (No specific timeseries referenced in the label) - User label
{{name}}results intimeseries_name_1 + timeseries_name_2 + 1label. (This works the same way as before)
- User label
[Custom query] Improved error handling
- HTTP 500 errors messages are visible from the GUI
[Custom query] Default granularity falls back to 1 second if shorter value is provided
- Previously, selecting a time span less than 10 minutes resulted in a HTTP 400 error.
2.0.0 - June 29, 2020
General improvements
- A new query language inspired by PromQL and compatible with synthetic time series in CDF. Learn more.
- Support for all filtering capabilities available in CDF API v1 for the respective resource types (assets, events, times series).
- Any future filtering capabilities added to CDF API v1 will be automatically supported by the data source (filters are passed directly to CDF).
- Query expressions resulting in errors now displays error messages in the UI.
- Regular expressions filtering can be used as part of the Query expression. The Filter field has been removed.
- Supports CDF API v1, with no dependency to older API versions.
- New documentation section for the connector, covering installation and administration, upgrades, feature documentation and getting started information.
- Compatibility with Grafana 7.0. Learn more about the new capabilities here.
Time series and custom queries
- You can now access time series that don't have the
legacyNameattribute populated with the data source. - Setting
Root Assetin the Custom query tab is no longer required. This filter has been removed from the UI and is now available as part of a custom query expression. For example:ts{rootAssetIds=[12335453, 3455566]}. - Custom query aggregation requests are less likely to trigger rate limiting in CDF API.
- Functions:
- Support for string time series through the new
mapfunction allows you to convert string values to numeric values which can then be plotted by Grafana. For example:map(ts{externalId='pump_29'}, ['OPEN', 'CLOSED'], [1, 0], -1). - Use the
on_errorfunction to gain control over query calculations resolving with errors, such as division by 0. The function allows you to set a default value for individual data points that resolved with errors. Without theon_errorfunction, the chart shows empty space in those places. Example:on_error(1/ts{externalId='canBeZero'}, 0). - Variable length functions:
max(x1, x2, ...),min(...),avg(...). - The
powerfunction has been renamed topow. - These functions are no longer supported:
acos,asin,atan,ceil,celing,cot,degrees,floor,log,log2,log10,radians,sign,tan,atan2,mod,truncate,rand,crc32,conv,div.
- Support for string time series through the new
- These aggregates are no longer supported by custom queries:
max,min,count,sum,continuousVariance,discreteVariance,totalVariation. - Short names for aggregation functions are no longer supported. Use full names
instead:
average,interpolation,stepInterpolation. - The
timeseries{options}function has been renamed tots{options}. - Filtering:
- New options:
isString=false,externalId='my_id',id=123,externalIdPrefix='my_' - Relate to asset tree with:
assetSubtreeIds=[{id=754173880412890},{externalId="23-TE-96148"}],assetIds=[123, 234],assetExternalIds=['pump_1', 'pump_2'],rootAssetIds=[123, 234] - New range filters for create and updated time:
createdTime={min=0, max= 1593018651},lastUpdatedTime={min=1493018651, max= 1593018651} - Select time series based on dataSet membership:
dataSetIds=[{externalId='Prediction Model A'},{id=123}] pathis no longer supported- See the full list of
supported filters
for the
ts{}expression.
- New options:
Annotations
- New filters:
assetExternalIds,rootAssetIds,dataSetIds,externalIdPrefix,source. - Find active events in range with the
activeAtTimefilter. IfendTimeis null, the event is active fromstartTimeonwards. TheactiveAtTimefilter will match all events that are active at some point frommintomax. Example:activeAtTime={min=1591018651, max= 1593018651}. descriptionsupports only regular expression operators=~,!~, and!=.minStartTime/maxStartTimehas been replaced by thestartTime={min=0, max= 1593018651}filter.minEndTime/maxEndTimehas been replaced by theendTime={min=0, max= 1593018651}filter, enabling you to also filter for events without theendTimeset:endTime={isNull=true}.minCreatedTime/maxCreatedTimehas been replaced by thecreatedTime={min=0, max= 1593018651}filter.minLastUpdatedTime/maxLastUpdatedTimehas been replaced by thelastUpdatedTime={min=0, max= 1593018651}filter.assetSubtreeshas been replaced by theassetSubtreeIds=[{id=754173880412890},{externalId="23-TE-96148"}]filter which introduces support forId/ExternalIdinput.- These filters are no longer supported:
sort,dir,limit,offset,sourceId. - See the full list of
supported filters
for the
events{}expression.
Templating
- New filters:
parentIds,parentExternalIds,rootIds,dataSetIds,externalIdPrefix,root. - The
descriptionfield supports only regular expression operators=~,!~, and!=. - Select assets based on label:
labels={contains={externalId="pump"}},labels={containsAny=[{externalId="pump_type_A"},{externalId="pump_type_B"}]},labels={containsAll=[{externalId="pump"},{externalId="rust_detected"}]} assetSubtreesreplaced by theassetSubtreeIds=[{id=754173880412890},{externalId="23-TE-96148"}]filter which introduces support forId/ExternalIdinputs.minCreatedTime/maxCreatedTimehas been replaced by thecreatedTime={min=0, max= 1593018651}filter.minLastUpdatedTime/maxLastUpdatedTimehas been replaced by thelastUpdatedTime={min=1592222651, max= 1593018651}filters.- These options are no longer supported:
query,sort,dir,offset,boostname,path,depth,sourceId. - See the full list of
supported filters for
the
assets{}expression.
Other
The Cognite Data Source for Grafana 2.0.0 is compatible with CDF API v1.
Cognite Data Source for Grafana 2.0.0 is not backward compatible with dashboards created using older versions of the connector. Follow the steps in the upgrade guide to upgrade your existing installation.
1.0.1 - May 27, 2019
- Rename Cognite Data Platform to Cognite Data Fusion.
- Allowing for templating variables to be used anywhere in custom queries.
- Allowing for the base url to be modified when adding a new data source.
Other
The Cognite Data Source for Grafana 1.0.1 is compatible with CDF API 0.5.
1.0.0 - March 26, 2019
- Fixing templating so that repeated panels/rows work properly.
- Changing checkboxes to Grafana checkboxes and adding Select All option.
- Fixing data source configuration to verify the project name.
- Breaking change:
function=inside oftimeseries{ ... }no longer works for custom queries. Instead, functions are now applied outside oftimeseries{}[]such as:(timeseries{description=~".*TEMP.*"}[avg] - 32) * 5/9sum(timeseries{name=~".*VALUE"}[count,1d])max(timeseries{metadata.on="True"}[count,5m]) - min(timeseries{metadata.on="True"}[count,5m])
Other
The Cognite Data Source for Grafana 1.0.0 is compatible with CDF API 0.5


