
Grafana Alloy
Grafana Alloy offers native pipelines for OTel, Prometheus, Pyroscope, Loki, and many other metrics, logs, traces, and profile tools. In addition, you can use Alloy pipelines to do other tasks, such as configure alert rules in Loki and Mimir. Alloy is fully compatible with the OTel Collector, Prometheus Agent, and Promtail.
You can use Alloy to collect and forward traces to Tempo. Using Alloy provides a hassle-free option, especially when dealing with multiple applications or microservices, allowing you to centralize the tracing process without changing your application’s codebase.
You can use Alloy as an alternative to either of these solutions or combine it into a hybrid system of multiple collectors and agents. You can deploy Alloy anywhere within your IT infrastructure and pair it with your Grafana LGTM stack, a telemetry backend from Grafana Cloud, or any other compatible backend from any other vendor. Alloy is flexible, and you can easily configure it to fit your needs for on-premise, cloud-only, or a mix of both.

It’s commonly used as a tracing pipeline, offloading traces from the application and forwarding them to a storage backend.
Grafana Alloy configuration files are written in the Alloy configuration syntax.
For more information, refer to the Introduction to Grafana Alloy.
Architecture
Grafana Alloy can run a set of tracing pipelines to collect data from your applications and write it to Tempo.
Pipelines are built using OpenTelemetry, and consist of receivers, processors, and exporters.
The architecture mirrors that of the OTel Collector’s design.
Refer to the components reference for all available configuration options.
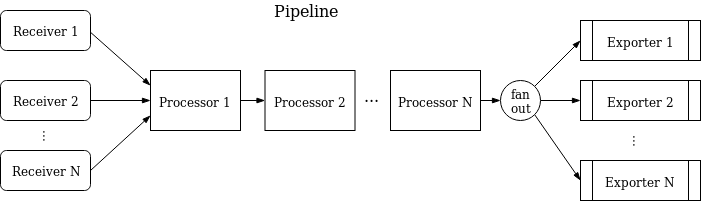
This lets you configure multiple distinct tracing pipelines, each of which collects separate spans and sends them to different backends.
Set up Alloy to receive traces
Grafana Alloy supports multiple ingestion receivers: OTLP (OpenTelemetry), Jaeger, Zipkin, OpenCensus, and Kafka.
Each tracing pipeline can be configured to receive traces in all these formats. Traces that arrive to a pipeline go through the receivers/processors/exporters defined in that pipeline.
To use Alloy for tracing, you need to:
- Set up Grafana Alloy
- Configure Grafana Alloy
- Set up any additional features
Refer to Collect and forward data with Grafana Alloy for examples of collecting data.
Set up pipeline processing
Grafana Alloy processes tracing data as it flows through the pipeline to make the distributed tracing system more reliable and leverage the data for other purposes such as trace discovery, tail-based sampling, and generating metrics.
Batching
Alloy supports batching of traces.
Batching helps better compress the data, reduces the number of outgoing connections, and is a recommended best practice.
To configure it, refer to the otelcol.processor.batch block in the
components reference.
Attributes manipulation
Grafana Alloy allows for general manipulation of attributes on spans that pass through it.
A common use may be to add an environment or cluster variable.
There are several processors that can manipulate attributes, some examples include: the otelcol.processor.attributes block in the
component reference and the otelcol.processor.transform block
component reference
Attach metadata with Prometheus Service Discovery
Prometheus Service Discovery mechanisms enable you to attach the same metadata to your traces as your metrics. For example, for Kubernetes users this means that you can dynamically attach metadata for namespace, Pod, and name of the container sending spans.
otelcol.receiver.otlp "default" {
  http {}
  grpc {}

  output {
    traces  = [otelcol.processor.k8sattributes.default.input]
  }
}

otelcol.processor.k8sattributes "default" {
  extract {
    metadata = [
      "k8s.namespace.name",
      "k8s.pod.name",
      "k8s.container.name"
    ]
  }

  output {
    traces = [otelcol.exporter.otlp.default.input]
  }
}

otelcol.exporter.otlp "default" {
  client {
    endpoint = env("OTLP_ENDPOINT")
  }
}
Refer to the otelcol.processor.k8sattributes block in the
components reference.
Trace discovery through automatic logging
Automatic logging writes well formatted log lines to help with trace discovery.
For a closer look into the feature, visit Automatic logging.
Tail-based sampling
Alloy implements tail-based sampling for distributed tracing systems and multi-instance Alloy deployments. With this feature, you can make sampling decisions based on data from a trace, rather than exclusively with probabilistic methods.
For a detailed description, refer to Tail sampling.
Generate metrics from spans
Alloy can take advantage of the span data flowing through the pipeline to generate Prometheus metrics.
Refer to Span metrics for a more detailed explanation of the feature.
Service graph metrics
Service graph metrics represent the relationships between services within a distributed system.
This service graphs processor builds a map of services by analyzing traces, with the objective to find edges. Edges are spans with a parent-child relationship, that represent a jump, such as a request, between two services. The amount of requests and their duration are recorded as metrics, which are used to represent the graph.
To read more about this processor, refer to Service graphs.
Export spans
Alloy can export traces to multiple different backends for every tracing pipeline. Exporting is built using OpenTelemetry Collector’s OTLP exporter. Alloy supports exporting tracing in OTLP format.
Aside from endpoint and authentication, the exporter also provides mechanisms for retrying on failure, and implements a queue buffering mechanism for transient failures, such as networking issues.
To see all available options,
refer to the otelcol.exporter.otlp block in the
Alloy configuration reference and the otelcol.exporter.otlphttp block in the
Alloy configuration reference.

