Push spans with HTTP or gRPC
Sometimes using a tracing system is intimidating because it seems like you need complex application instrumentation or a span ingestion pipeline to push spans. This guide shows a basic technique for pushing spans with HTTP/JSON or gRPC using the OpenTelemetry receiver.
Before you begin
This procedure uses an example Docker Compose setup to run Tempo, so you don’t need an existing installation. The Docker image also includes a Grafana container which lets you visualize traces.
To use this procedure, you need:
- Docker and
docker composeinstalled - (Optional) OpenTelemetry
telemetrygeninstalled for the gRPC examples
Start Tempo using the quickstart
Use the instructions in the Quick start for Tempo documentation to start a local instance of Tempo and Grafana.
Push spans with OTLP/HTTP
Now that Tempo is running and listening on port 4318 for OTLP/HTTP spans, you can push a span to Tempo using curl.
Before you can use this example, you need to update the start and end time.
The startTimeUnixNano and endTimeUnixNano fields are in nanoseconds, where 100000000 nanoseconds is 100 milliseconds. The nanosecond value can be obtained by any tool that provides the epoch date in nanoseconds.
For example, under Linux, you can use date +%s%N.
You can also use an online tool such as Epoch Converter to get the current time in nanoseconds.
Copy and paste the
curlcommand into a text editor.curl -X POST -H 'Content-Type: application/json' http://localhost:4318/v1/traces -d ' { "resourceSpans": [{ "resource": { "attributes": [{ "key": "service.name", "value": { "stringValue": "my.service" } }] }, "scopeSpans": [{ "scope": { "name": "my.library", "version": "1.0.0", "attributes": [{ "key": "my.scope.attribute", "value": { "stringValue": "some scope attribute" } }] }, "spans": [ { "traceId": "5B8EFFF798038103D269B633813FC700", "spanId": "EEE19B7EC3C1B100", "name": "I am a span!", "startTimeUnixNano": 1689969302000000000, "endTimeUnixNano": 1689970000000000000, "kind": 2, "attributes": [ { "key": "my.span.attr", "value": { "stringValue": "some value" } }] }] }] }] }'Replace
startTimeUnixNanoandendTimeUnixNanowith current values for the last 24 hours to allow you to search for them using a 24 hour relative time range. You can get this in seconds and milliseconds from the Unix Epoch Clock. ForstartTimeUnixNano, use the current time minus 24 hours. Use the link above to figure out the value. ForendTimeUnixNano, use the current time.Multiply the milliseconds value by 1,000,000 to turn it into nanoseconds. You can do this from a bash terminal with the following command. Replace
<epochTimeMilliseconds>with the milliseconds value.echo $((<epochTimeMilliseconds> * 1000000))Copy the updated curl command to a terminal window and run it.
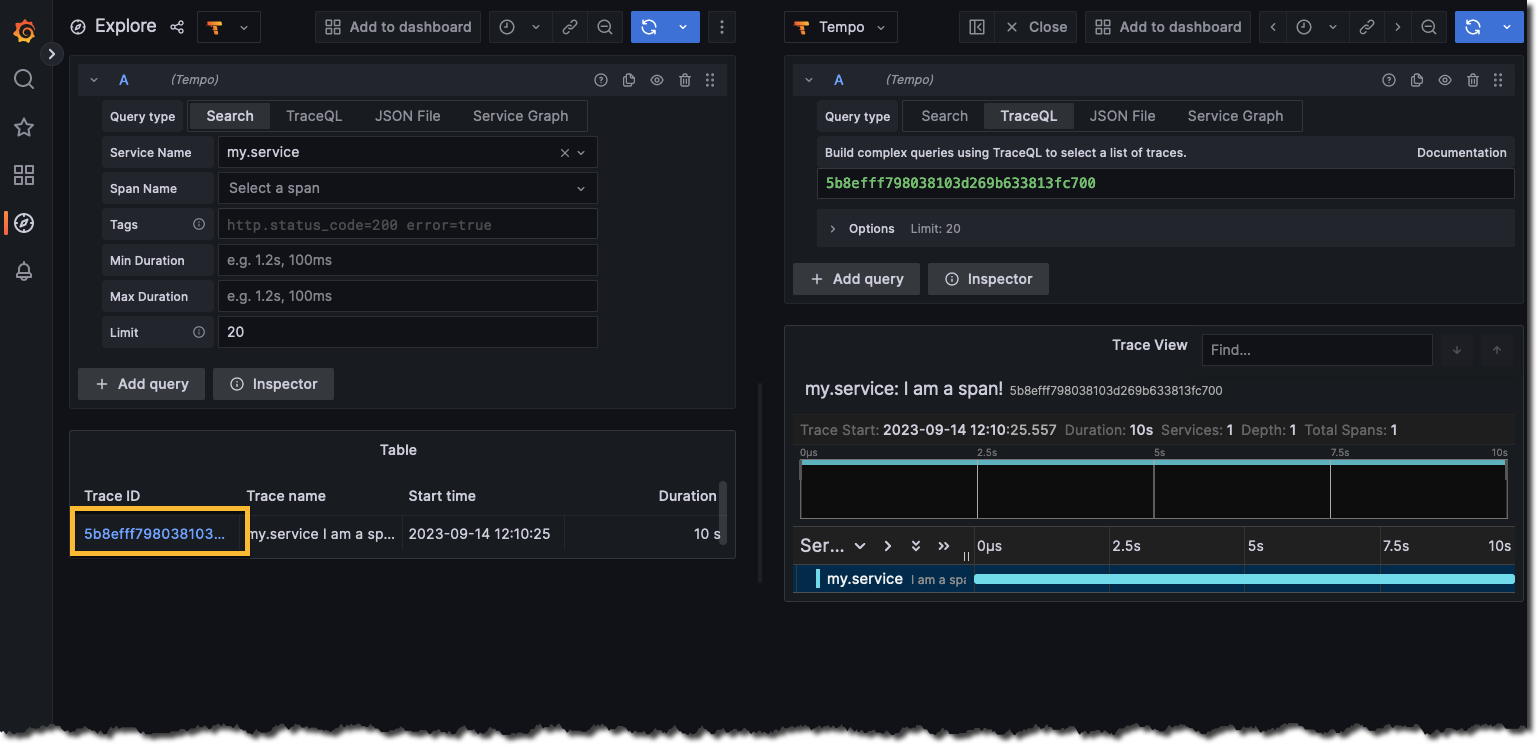
- View the trace in Grafana:
- Open a browser window to http://localhost:3000.
- Open the Explore page and select the Tempo data source.
- Select the Search query type.
- Select Run query to list available traces.
- Select the trace ID (yellow box) to view details about the trace and its spans.
Push spans with OTLP/gRPC
Tempo also listens on port 4317 for OTLP/gRPC spans.
You can use OpenTelemetry telemetrygen to push test traces over gRPC.
Install
telemetrygenfollowing the installation instructions.Push traces to Tempo over gRPC:
telemetrygen traces --otlp-insecure --rate 20 --duration 5s --otlp-endpoint localhost:4317This sends 100 traces (20 per second for 5 seconds) to the Tempo distributor’s OTLP/gRPC receiver.
Verify the traces arrived by searching for them. The
telemetrygentool uses the service nametelemetrygenby default:curl -G -s http://localhost:3200/api/search --data-urlencode 'q={ resource.service.name = "telemetrygen" }' | jq .
Multi-tenancy
If you’ve enabled multi-tenancy (multitenancy_enabled: true), pass the tenant ID using the X-Scope-OrgID header in gRPC metadata:
telemetrygen traces --otlp-insecure --rate 20 --duration 5s \
  --otlp-endpoint localhost:4317 \
  --otlp-header "X-Scope-OrgID=my-tenant"
For more information about configuring OpenTelemetry SDKs to export traces over gRPC, refer to the OpenTelemetry documentation.
Retrieve traces
You can retrieve the trace by running a curl command against Tempo. The returned format is OTLP.
Replace the trace ID in the
curlcommand with the trace ID that was generated from the push. This information is in the data that’s sent with thecurl. You can use the Grafana Explore page to find this, as shown in the previous section.curl http://localhost:3200/api/v2/traces/5b8efff798038103d269b633813fc700 {"trace": {"resourceSpans":[{"resource":{"attributes":[{"key":"service.name","value":{"stringValue":"my.service"}}]},"scopeSpans":[{"scope":{"name":"my.library","version":"1.0.0"},"spans":[{"traceId":"W47/95gDgQPSabYzgT/HAA==","spanId":"7uGbfsPBsQA=","name":"I am a span!","kind":"SPAN_KIND_SERVER","startTimeUnixNano":"1689969302000000000","endTimeUnixNano":"1689970000000000000","attributes":[{"key":"my.span.attr","value":{"stringValue":"some value"}}],"status":{}}]}]}]}}Copy and paste the updated
curlcommand into a terminal window.
Use TraceQL to search for a trace
Alternatively, you can also use TraceQL to search for the trace that was pushed. You can search by using the unique trace attributes that were set:
curl -G -s http://localhost:3200/api/search --data-urlencode 'q={ resource.service.name = "my.service" }'

{"traces":[{"traceID":"5b8efff798038103d269b633813fc700","rootServiceName":"my.service","rootTraceName":"I am a span!","startTimeUnixNano":"1694718625557000000","durationMs":10000,"spanSet":{"spans":[{"spanID":"eee19b7ec3c1b100","startTimeUnixNano":"1694718625557000000","durationNanos":"10000000000","attributes":[{"key":"service.name","value":{"stringValue":"my.service"}}]}],"matched":1},"spanSets":[{"spans":[{"spanID":"eee19b7ec3c1b100","startTimeUnixNano":"1694718625557000000","durationNanos":"10000000000","attributes":[{"key":"service.name","value":{"stringValue":"my.service"}}]}],"matched":1}]}],"metrics":{"inspectedBytes":"292781","completedJobs":1,"totalJobs":1}}
To format this in a more human-readable output, consider using a tool such as jq, which lets you to run the same curl command and pipe it to jq to format the block. For example:
curl -G -s http://localhost:3200/api/search --data-urlencode 'q={ resource.service.name = "my.service" }' | jq
