Analyze service graph data
You can use this collection of PromQL queries to explore service graph metrics.
Grafana uses the service graph metrics created by Tempo and builds that visual for the user. However, you may want to interact with the metrics that define that service graph directly. You may want to, for example, programmatically analyze how your services are interconnected and build downstream applications that use this information.
Instant Queries
An instant query gives a single value at the end of the selected time range. Instant queries are quicker to execute and it often easier to understand their results. We prefer them in some scenarios:
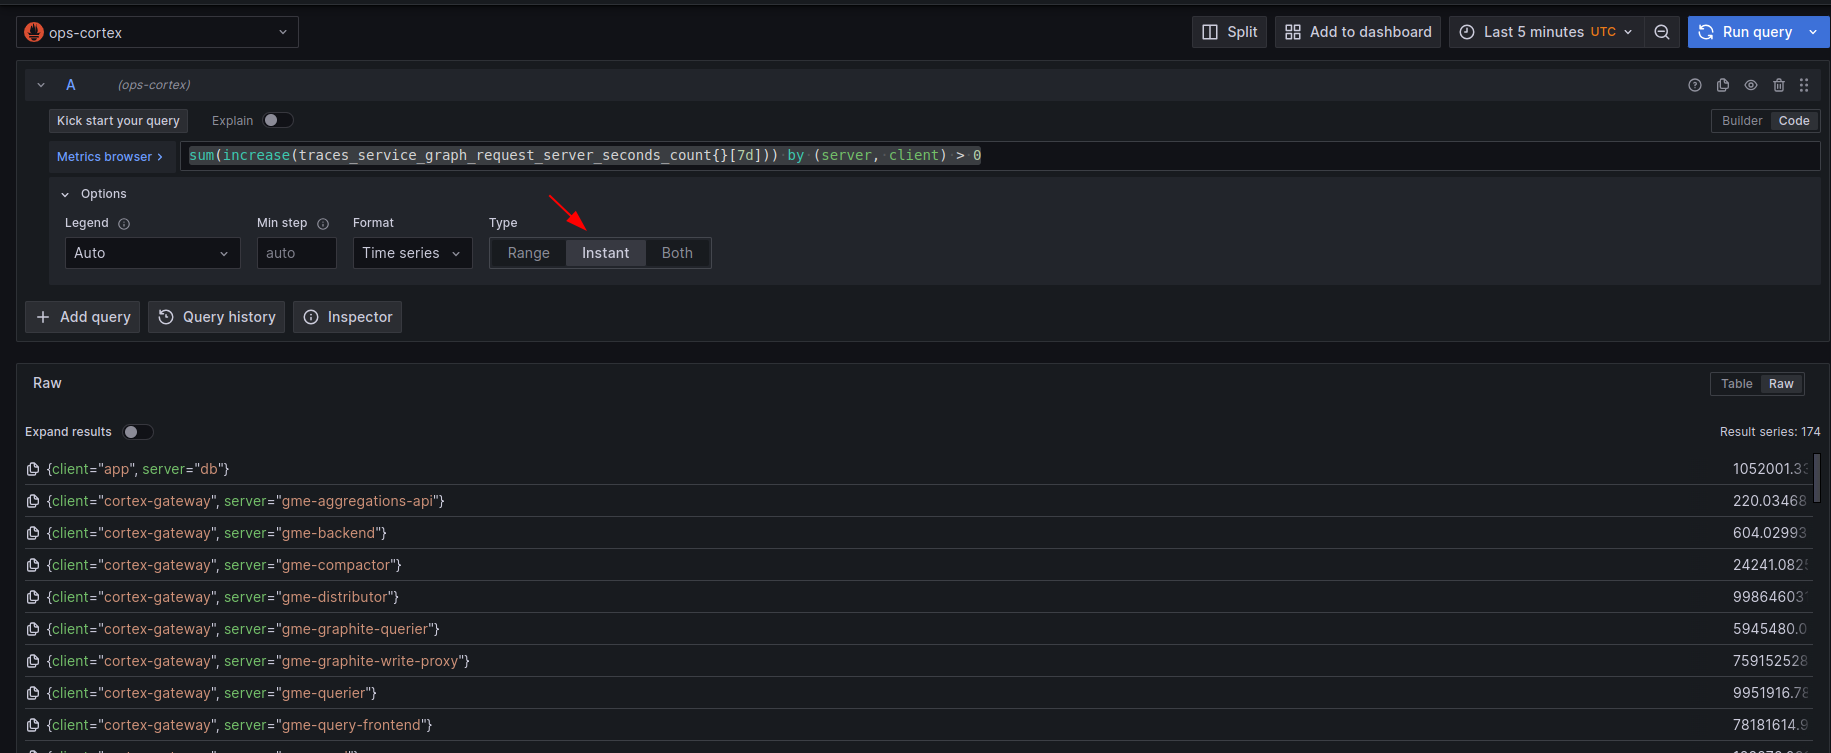
Connectivity between services
Show the total calls in the last 7 days for every client/server pair:
sum(increase(traces_service_graph_request_server_seconds_count{}[7d])) by (server, client) > 0Use this query to only see when a single service is the server:
sum(increase(traces_service_graph_request_server_seconds_count{server="foo"}[7d])) by (client) > 0If you’d like to only see when a single service is the client:
sum(increase(traces_service_graph_request_server_seconds_count{client="foo"}[7d])) by (server) > 0In all of the above queries, you can adjust the interval to change the amount of time this is calculated for. So if you wanted the same analysis done over one day:
sum(increase(traces_service_graph_request_server_seconds_count{}[1d])) by (server, client) > 0Range queries
Range queries are nice for calculating service graph info over a time range instead of a single point in time.
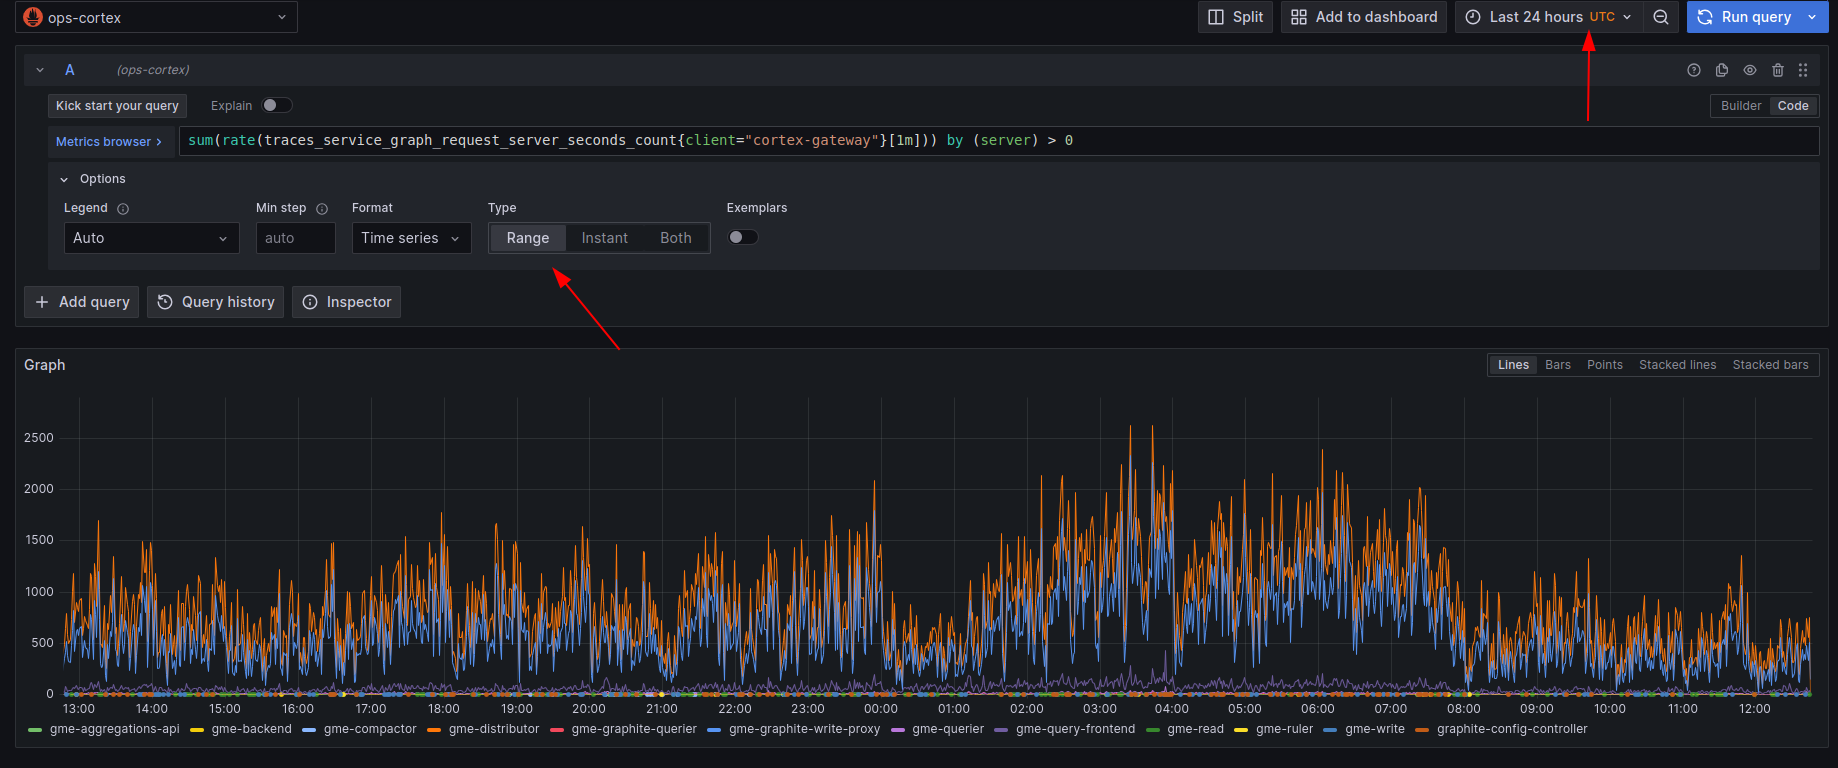
Rates over time between services
Taking two of the queries above, we can request the rate over time that any given service acted as the client or server:
sum(rate(traces_service_graph_request_server_seconds_count{server="foo"}[5m])) by (client) > 0

sum(rate(traces_service_graph_request_server_seconds_count{client="foo"}[5m])) by (server) > 0
Notice that our interval dropped to 5m. This is so we only calculate the rate over the past 5 minutes which creates a more responsive graph.
Latency percentiles over time between services
These queries provide latency quantiles for the above rate.
If you’re interested in how the latency changed over time between any two services we could use these. In the following query the .9 means we’re calculating the 90th percentile.
Adjust this value if you want to calculate a different percentile for latency, for example, p50, p95, p99.
histogram_quantile(.9, sum(rate(traces_service_graph_request_server_seconds_bucket{client="foo"}[5m])) by (server, le))Using the optional metric for latency of a messaging system to see potential middleware latencies:
histogram_quantile(.9, sum(rate(traces_service_graph_request_messaging_system_seconds_bucket{}[5m])) by (client, server, le))
