
Active series
An active series is a time series that receives new data points or samples. When you stop writing new data points to a time series, shortly afterwards it’s no longer considered active.
Metrics generated by the metrics-generator can provide both RED (Rate/Error/Duration) metrics and interdependency graphs between services in a trace (the Service Graph functionality in Grafana). These capabilities rely on a set of generated span metrics and service metrics.
Any spans that are ingested by Tempo can create many metric series. However, this doesn’t mean that every time a span is ingested that a new active series is created.
The number of active series generated depends on the label pairs generated from span data that are associated with the metrics, similar to other Prometheus-formated data.
For additional information, refer to the Active series and DPM documentation.
Active series calculation
Active series for a metric increase when a new value for a label key is introduced. For example, the span_kind label has a total of five possible values, and the status_code label has a total of three possible values.
At first glance, you might make an assumption that this means that at least 15 (5*3) active series will be generated for each span. But this isn’t the case.
Let’s consider a span that’s emitted from some piece of code in a service:
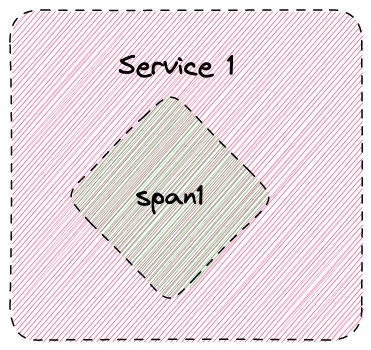
Here’s a single service with a single span.
If the code inside the span never leaves the service, then the span_kind label generated by the metrics generator will be SPAN_KIND_INTERNAL and never deviate. It’ll never be one of the other four possible values.
Similarly, if the code inside the span never errors, it’ll only have the STATUS_CODE_OK state for the span_status label.
This means that the metrics generator will only generate a single active series, where the service name will be Service 1 and the span name will be span1.
If we looked at the Prometheus data for the traces_spanmetrics_call_total metric, we’d see a single active series:
| service | span_name | span_kind | status_code | Metric value |
|---|---|---|---|---|
| Service 1 | span1 | SPAN_KIND_INTERNAL | STATUS_CODE_OK | 1 |
It doesn’t matter how many times that span occurs in a trace either, for example maybe a span is generated within a loop. In code run once, 10 times, 100 times, 1000 times, only a single active series will be produced, where a counter might be increased 1, 10, 100, or 1000 times:
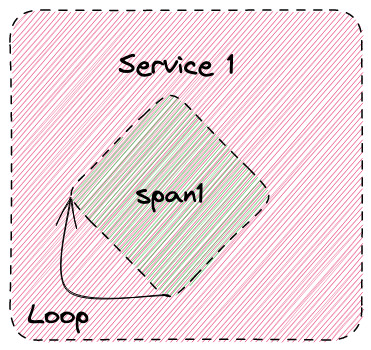
If you looked at the Prometheus data, you’d see an instant value for traces_spanmetrics_call_total similar to the table. Again, one active series for the metric:
| service | span_name | span_kind | status_code | Metric value |
|---|---|---|---|---|
| Service 1 | span1 | SPAN_KIND_INTERNAL | STATUS_CODE_OK | 120 |
However, let’s now assume that it does loop and there are occasionally errors.
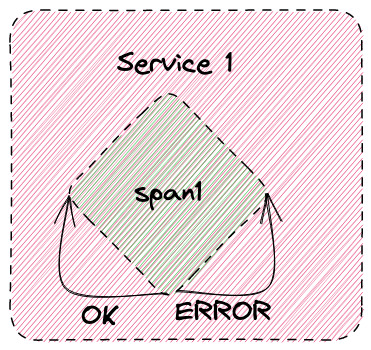
There are now two potential outcomes for a span when the code loops: one where everything successfully completes and one where there is an error.
This means that when the span completes status_code is now either STATUS_CODE_OK or STATUS_CODE_ERROR.
Because of that, the label values can be one of two values on a metric, and we now have two active series being generated based on the status_code, one for the OK status and one for the error.
Again, we could loop once, 10 times, 100, or more times, but there will only ever be two active series.
If we now looked at Prometheus instant values for traces_spanmetrics_call_total, we’d now see the following table:
| service | span_name | span_kind | status_code | Metric value |
|---|---|---|---|---|
| Service 1 | span1 | SPAN_KIND_INTERNAL | STATUS_CODE_OK | 96 |
| Service 1 | span1 | SPAN_KIND_INTERNAL | STATUS_CODE_ERROR | 24 |
What happens if you call out to another service though? Let’s add an option where, based on some arbitrary data, we sometimes make a downstream call to another service, but otherwise continue to runs loops in our own service:
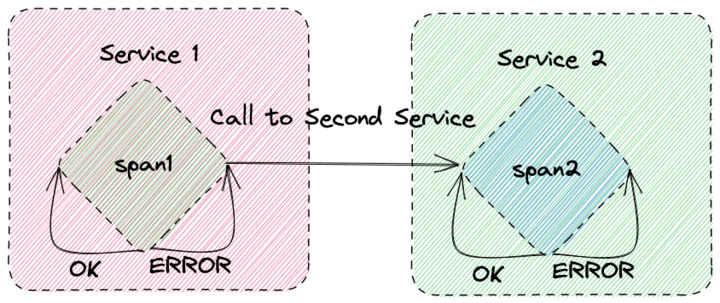
In this scenario, span1’s span_kind label would now be one of either SPAN_KIND_INTERNAL or SPAN_KIND_CLIENT (as it has acted as a client calling a downstream server).
If a call to the downstream service could also potentially fail, then for SPAN_KIND_CLIENT, the status_code could be either STATUS_CODE_ERROR or STATUS_CODE_OK.
At this point, traces_spanmetrics_call_total would have four different variations in labels:
| service | span_name | span_kind | status_code | Metric value |
|---|---|---|---|---|
| Service 1 | span1 | SPAN_KIND_INTERNAL | STATUS_CODE_OK | 34 |
| Service 1 | span1 | SPAN_KIND_INTERNAL | STATUS_CODE_ERROR | 6 |
| Service 1 | span1 | SPAN_KIND_CLIENT | STATUS_CODE_OK | 23 |
| Service 1 | span1 | SPAN_KIND_CLIENT | STATUS_CODE_ERROR | 3 |
Because of the variation in values, we now have four active series for our metric instead of one. But, as far as Service 1 is concerned, there’s still only four active series, because there isn’t any other variation of the values for labels. You can run 1 trace, 10 traces, 100 traces (each with however many loops of spans there are) and only four active series will ever be produced.
We’ve actually only told half the story in our last diagram. Service 1 called a second service, Service 2, which continues the trace by adding a new span, span2.
If there was a loop inside Service 2 with a single span that was generated from an upstream call from Service 1, and then a number of spans that were driven internally, which could also error, we’d end up with the possible values in the metric for traces_spanmetrics_call_total below:
| service | span_name | span_kind | status_code | Metric value |
|---|---|---|---|---|
| Service 1 | span1 | SPAN_KIND_INTERNAL | STATUS_CODE_OK | 89 |
| Service 1 | span1 | SPAN_KIND_INTERNAL | STATUS_CODE_ERROR | 13 |
| Service 1 | span1 | SPAN_KIND_CLIENT | STATUS_CODE_OK | 44 |
| Service 1 | span1 | SPAN_KIND_CLIENT | STATUS_CODE_ERROR | 9 |
| Service 2 | span2 | SPAN_KIND_SERVER | STATUS_CODE_OK | 30 |
| Service 2 | span2 | SPAN_KIND_SERVER | STATUS_CODE_ERROR | 14 |
| Service 2 | span2 | SPAN_KIND_INTERNAL | STATUS_CODE_OK | 99 |
| Service 2 | span2 | SPAN_KIND_INTERNAL | STATUS_CODE_ERROR | 23 |
At this point, all our traces will be composed of two potential span names, each of which produce two separate types of span_kind and two separate types of status_code. So we have eight active series for a metric.
The variability of values for each potential span condition determines the number of active series being produced by Tempo when ingesting spans for a trace, and not the number of traces of spans that are seen.
Custom span attributes
There’s another consideration for active series: extra label key/value pairs that can be added onto metrics from a span’s attributes. The Tempo metrics generator allows the user to use arbitrary span attributes to be created as label pairs for metrics. When considering the number of active series generated, you also need to determine how many possible values there are for the span attribute being turned into a label.
For example, if you added an http.method span attribute into a metric label pair, there are five possible values (because there are five possible REST methods):
HEADGETPOSTPUTDELETE
If this label pair is added to every span metric, that’s another 5 potential active series generated for each metric (in all likelihood this is a very worst case scenario, very few spans will call all five REST methods). Instead of 8 active series in the last table above, we’d have 40 (8 * 5).
Was this page helpful?
Related resources from Grafana Labs

