Plugins 〉Influx Admin


The Influx Admin plugin has been deprecated and is no longer maintained.
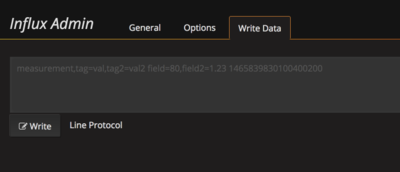
Influx Admin


InfluxDB admin
This panel duplicates features from the now depricated Web Admin Interface.
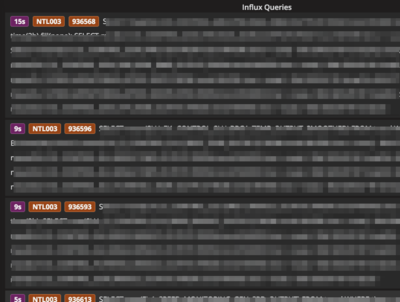
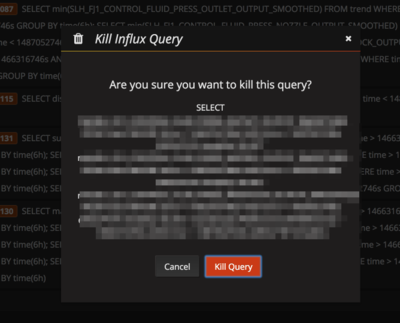
This panel lets you see the currently running queries and easily kill them.
This plugin expects there to be at least one InfluxDB datasource configured.
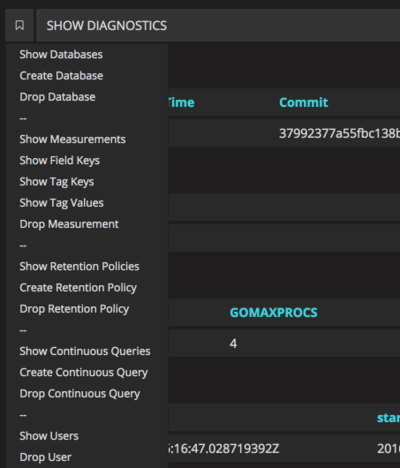
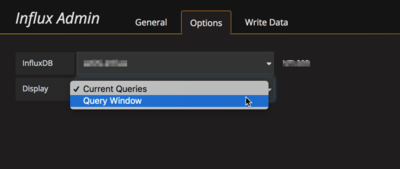
Screenshots
Building
To complie, run:
npm install -g yarn
yarn install --pure-lockfile
grunt
Changelog
v0.0.5
- Now supports $timeFilter in query
- Now supports datasource defined as a template variable
- Added more debug query templates
- Fix write request bug
- Support Grafana 5+
v0.0.4
- Fix issue always showing query results
- When there is only one row, swap rows/cols (ie: SHOW DIAGNOSTICS)
- Improve auto-refresh behavior.
- Show 'message' response. (ie: please use POST)
- Fix query time sorting
- show 'status' field (killed, etc)
v0.0.3
- Converted to typescript project based on typescript-template-datasource
- Select Databases. This only works with PR#8096
- Added time format options
- Show tags from response
- Support template variables in the query
v0.0.2
- Save the configuration properly
v0.0.1
- First working version
Grafana Cloud Free
- Free tier: Limited to 3 users
- Paid plans: $55 / user / month above included usage
- Access to all Enterprise Plugins
- Fully managed service (not available to self-manage)
Self-hosted Grafana Enterprise
- Access to all Enterprise plugins
- All Grafana Enterprise features
- Self-manage on your own infrastructure
Install on Grafana Cloud
Plugins can be installed directly from within your Grafana instance or automated using the Cloud API or Terraform.
Learn more about plugin installationMarketplace plugins
This is a paid plugin developed by a marketplace partner. To purchase an entitlement, sign in first, then fill out the contact form.
Get this plugin
This is a paid for plugin developed by a marketplace partner. To purchase entitlement please fill out the contact us form.
What to expect:
- Grafana Labs will reach out to discuss your needs
- Payment will be taken by Grafana Labs
- Once purchased the plugin will be available for you to install (cloud) or a signed version will be provided (on-premise)
Thank you! We will be in touch.
For more information, visit the docs on plugin installation.
Installing on a local Grafana:
For local instances, plugins are installed and updated via a simple CLI command. Plugins are not updated automatically, however you will be notified when updates are available right within your Grafana.
1. Install the Panel
Use the grafana-cli tool to install Influx Admin from the commandline:
grafana-cli plugins install The plugin will be installed into your grafana plugins directory; the default is /var/lib/grafana/plugins. More information on the cli tool.
Alternatively, you can manually download the .zip file for your architecture below and unpack it into your grafana plugins directory.
Alternatively, you can manually download the .zip file and unpack it into your grafana plugins directory.
2. Add the Panel to a Dashboard
Installed panels are available immediately in the Dashboards section in your Grafana main menu, and can be added like any other core panel in Grafana.
To see a list of installed panels, click the Plugins item in the main menu. Both core panels and installed panels will appear.