
Grafana Button Control Panel


This panel allows you to create buttons and define actions for them. It can be used to add control functionality to your dashboards. Actions are defined as queries to Datasources.
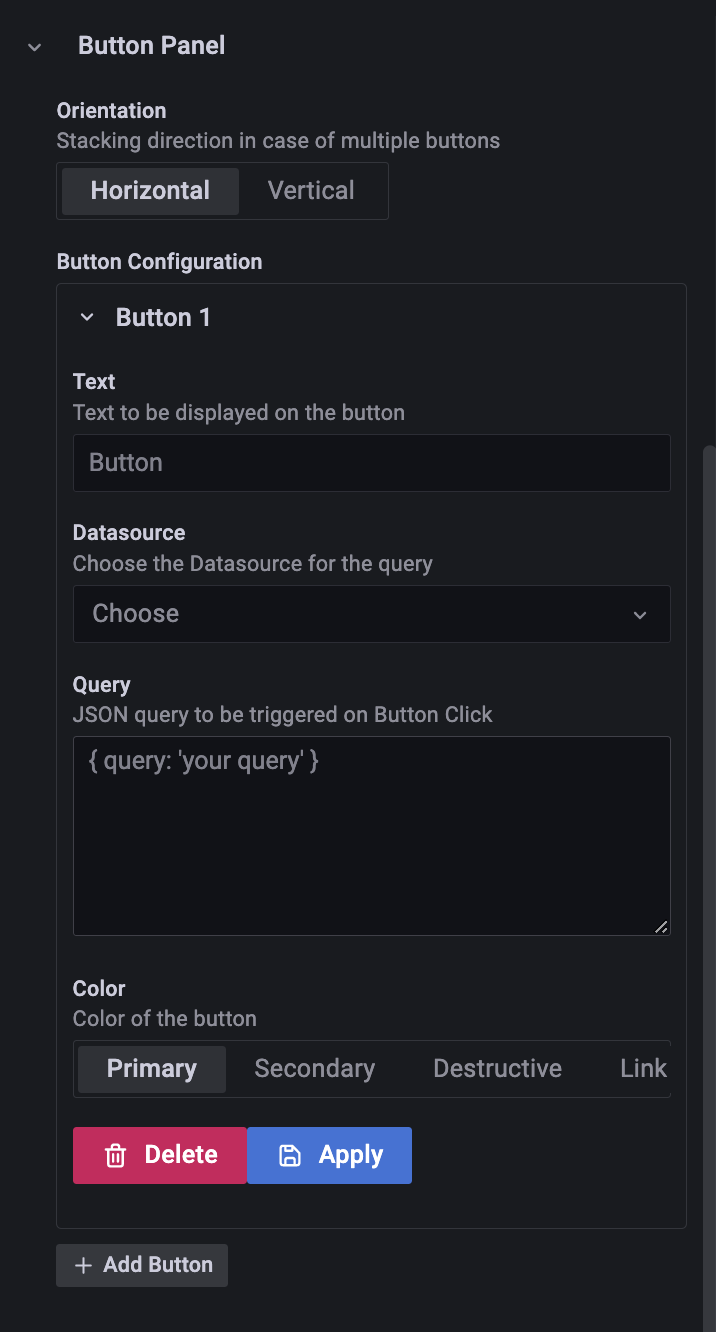
Multiple buttons are allowed within a single panel, they can be arranged either horizontally or vertically.


The query field is a JSON object, that depends on each Datasource type. You can use Grafana's Query Inspector to find out what Grafana sends to each Datasource, and copy those into the query field.
Examples
Query field to delete InfluxDB database:
{
  "query": "drop database \"foo\"",
  "rawQuery": true,
  "resultFormat": "time_series"
}
Same example with PostgreSQL:
{
  "rawSql": "DROP DATABASE foo;",
  "format": "table"
}
refId, datasourceId are automatically sent, so you don't have to set them.
Grafana Cloud
Connect any plugin in Grafana Cloud.
- 150+ data source integrations
- Grafana Assistant - AI that correlates your data, builds queries, and answers questions
- 10k Prometheus metrics + 50 GB logs, traces, and profiles on the free tier
- ...and more
Insights
- Adoption
Running on 32,846 active Grafana instances.
- Activity
Last updated 16 Dec 2022.
0 releases in the past year.
- Version
- 0.3.2
- Dependencies
- Grafana >=9.1.2
- Developer
- speakyourcode
Grafana Cloud
Connect any plugin in Grafana Cloud.
- 150+ data source integrations
- Grafana Assistant - AI that correlates your data, builds queries, and answers questions
- 10k Prometheus metrics + 50 GB logs, traces, and profiles on the free tier
- ...and more