Plugins 〉Sneller


Sneller


Sneller Grafana Data Source
Introduction
The official Sneller data source plugin for Grafana can be used to conveniently visualize data from a Sneller database or to create alerts that are triggered when certain conditions are met.
Installation
Please follow the official documentation on how to install a public data source from the store: https://grafana.com/docs/grafana/latest/administration/data-source-management/#add-a-data-source
Search for "Sneller" to find the official Sneller data source.
Configuration
The Sneller data source only requires a small handful of settings to get started.
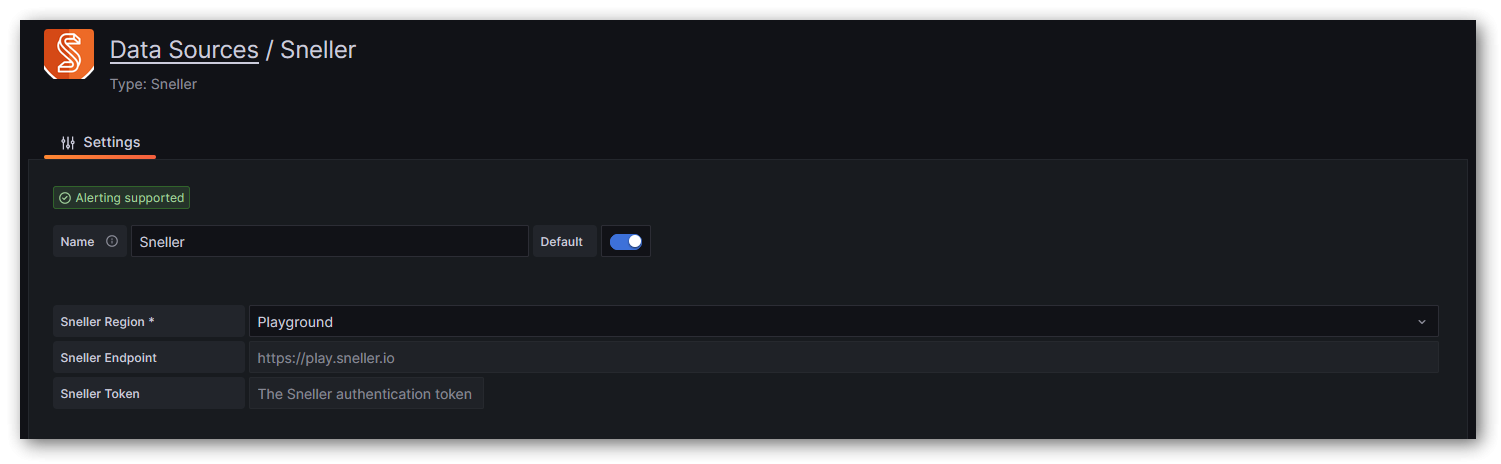
Sneller Region
If you are using Sneller Cloud, you can select your bucket region (e.g. us-east-1) from the drop-down menu to automatically configure the endpoint URL.
If you are using a self-hosted Sneller instance, please select custom and make sure to enter your endpoint URL as well.
If you are not yet using Sneller for your production data, but would like to experiment with some preset data, select playground to get free access to a demo database containing a large dataset such as the GitHub Archive 2021. In this case, no endpoint and token need to be configured.
Sneller Endpoint
This value is automatically set for Sneller Cloud instances after you select your bucket region in the Sneller Region drop-down menu.
For self-hosted Sneller instances, this value must be set to your snellerd endpoint URL.
Sneller Token
Please insert the Sneller access token that will be used to retrieve data. This can either be the token you received during the initial setup of the tenant or a custom PAT.
You do not need to specify a token for the playground region.
Getting Started
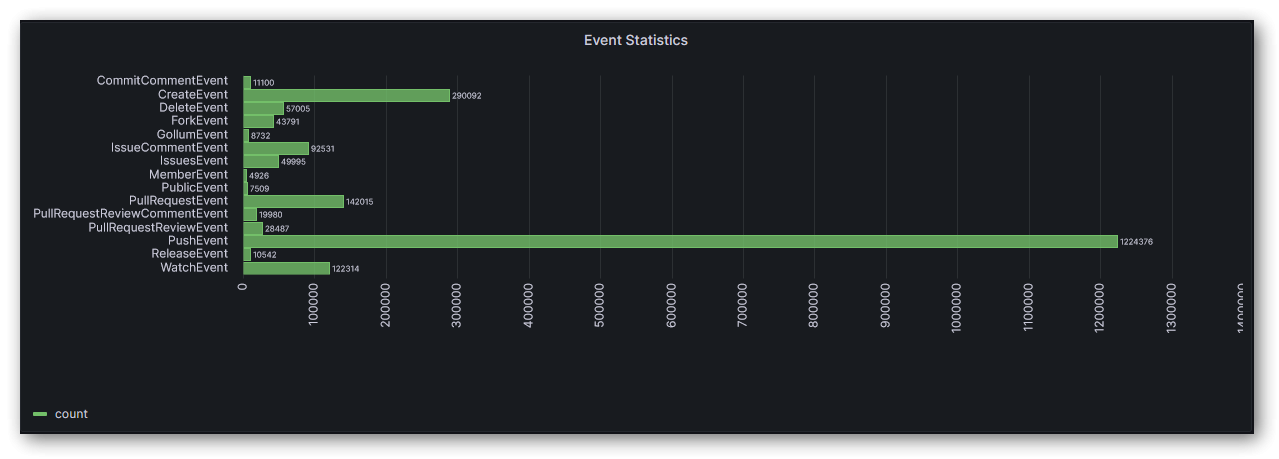
In this example we do operate on the playground data in the gha table of the demo database.
After creating a dashboard, we add our first panel and paste the following query text in the query editor:
SELECT COUNT(*),
       type
FROM gha
WHERE $__timeFilter(created_at)
GROUP BY type
ORDER BY type
Voila! After setting the date-range to something like 2021-01-30 22:00:00 to 2021-01-31 22:00:00 (just an example range for which the GitHub Archive 2021 contains records), we can see the following graph:
Macros and Variables
The Sneller data source supports some useful macros and variables that can be used in your queries.
$__from and $__to
| Syntax | Example result | Description |
|---|---|---|
${__from} | 1594671549254 | Unix millisecond epoch |
${__from:date} | 2020-07-13T20:19:09.254Z | No args, defaults to ISO 8601/RFC 3339 |
${__from:date:iso} | 2020-07-13T20:19:09.254Z | ISO 8601/RFC 3339 |
${__from:date:seconds} | 1594671549 | Unix seconds epoch |
$__interval_ms
You can use the $__interval_ms variable as a parameter to group by time.
Grafana automatically calculates an interval that can be used to group by time in queries. When there are more data points than can be shown on a graph, then queries can be made more efficient by grouping by a larger interval. It is more efficient to group by 1 day than by 10s when looking at 3 months of data and the graph will look the same and the query will be faster. The $__interval_ms is calculated using the time range and the width of the graph (the number of pixels).
$__max_data_points
The maximum amount of data points that can be visualized by the graph. You can use this value as a LIMIT for your query.
$__timeFilter(field)
This helper macro translates to field BETWEEN $__from AND $__to and can be used for convenient input range restriction.
$__timeGroup(field)
This helper macro translates to DATE_BIN('$__interval_ms milliseconds', field, `${__from:date:iso}`) and can be used for convenient time bucket grouping.
$__time(field)
A time field is required for time series charts. In some cases, these values are not stored as timestamp data or calculated on demand. Use this macro to mark a specific field as a "time" field. The data source will attempt to convert these values to timestamps as needed. Currently numeric values in UNIX millisecond timestamp format and strings in RFC3339 format are supported.
Grafana Cloud Free
- Free tier: Limited to 3 users
- Paid plans: $55 / user / month above included usage
- Access to all Enterprise Plugins
- Fully managed service (not available to self-manage)
Self-hosted Grafana Enterprise
- Access to all Enterprise plugins
- All Grafana Enterprise features
- Self-manage on your own infrastructure
Installing Sneller on Grafana Cloud:
Installing plugins on a Grafana Cloud instance is a one-click install; same with updates. Cool, right?
Note that it could take up to 1 minute to see the plugin show up in your Grafana.
Warning
Plugin installation from this page will be removed in February 2026. Use the Plugin Catalog in your Grafana instance instead. Refer to Install a plugin in the Grafana documentation for more information.
Installing plugins on a Grafana Cloud instance is a one-click install; same with updates. Cool, right?
Note that it could take up to 1 minute to see the plugin show up in your Grafana.
Installing plugins on a Grafana Cloud instance is a one-click install; same with updates. Cool, right?
Note that it could take up to 1 minute to see the plugin show up in your Grafana.
Warning
Plugin installation from this page will be removed in February 2026. Use the Plugin Catalog in your Grafana instance instead. Refer to Install a plugin in the Grafana documentation for more information.
Installing plugins on a Grafana Cloud instance is a one-click install; same with updates. Cool, right?
Note that it could take up to 1 minute to see the plugin show up in your Grafana.
For more information, visit the docs on plugin installation.
Installing on a local Grafana:
For local instances, plugins are installed and updated via a simple CLI command. Plugins are not updated automatically, however you will be notified when updates are available right within your Grafana.
1. Install the Data Source
Use the grafana-cli tool to install Sneller from the commandline:
grafana-cli plugins install The plugin will be installed into your grafana plugins directory; the default is /var/lib/grafana/plugins. More information on the cli tool.
Alternatively, you can manually download the .zip file for your architecture below and unpack it into your grafana plugins directory.
Alternatively, you can manually download the .zip file and unpack it into your grafana plugins directory.
2. Configure the Data Source
Accessed from the Grafana main menu, newly installed data sources can be added immediately within the Data Sources section.
Next, click the Add data source button in the upper right. The data source will be available for selection in the Type select box.
To see a list of installed data sources, click the Plugins item in the main menu. Both core data sources and installed data sources will appear.
Changelog
1.0.0
Initial release.