
Plugins 〉Sift


- Grafana, of course
- 10k series Prometheus metrics
- 50 GB logs
- 50 GB traces
- 2,232 app o11y host hours
- ...and more
No credit card needed, ever.
- Reduce metric cardinality by 30-50%
- Pay only for metrics you use
- Centralize control over your data in Grafana Cloud
Gain insight into unused metrics and optimize metric cardinality with the new cardinality management dashboards and Adaptive Metrics


Sift


Sift Grafana Datasource
![]()

Overview
This is a Grafana datasource plugin for Sift. It allows you to query Sift for data and visualize it in Grafana dashboards. The plugin supports both simple channel queries and calculated channel expressions.
Compatibility
This plugin is compatible with Grafana versions 11.0.0 and above.
User Guide
Configuration
To configure the plugin, you will need:
- The Sift REST API endpoint URL
- A valid Sift API key
Instructions for getting these values can be found in the Sift documentation. Enter these values when creating the datasource in Grafana.
Usage
- Create a dashboard and add a panel
- Select the Sift data source
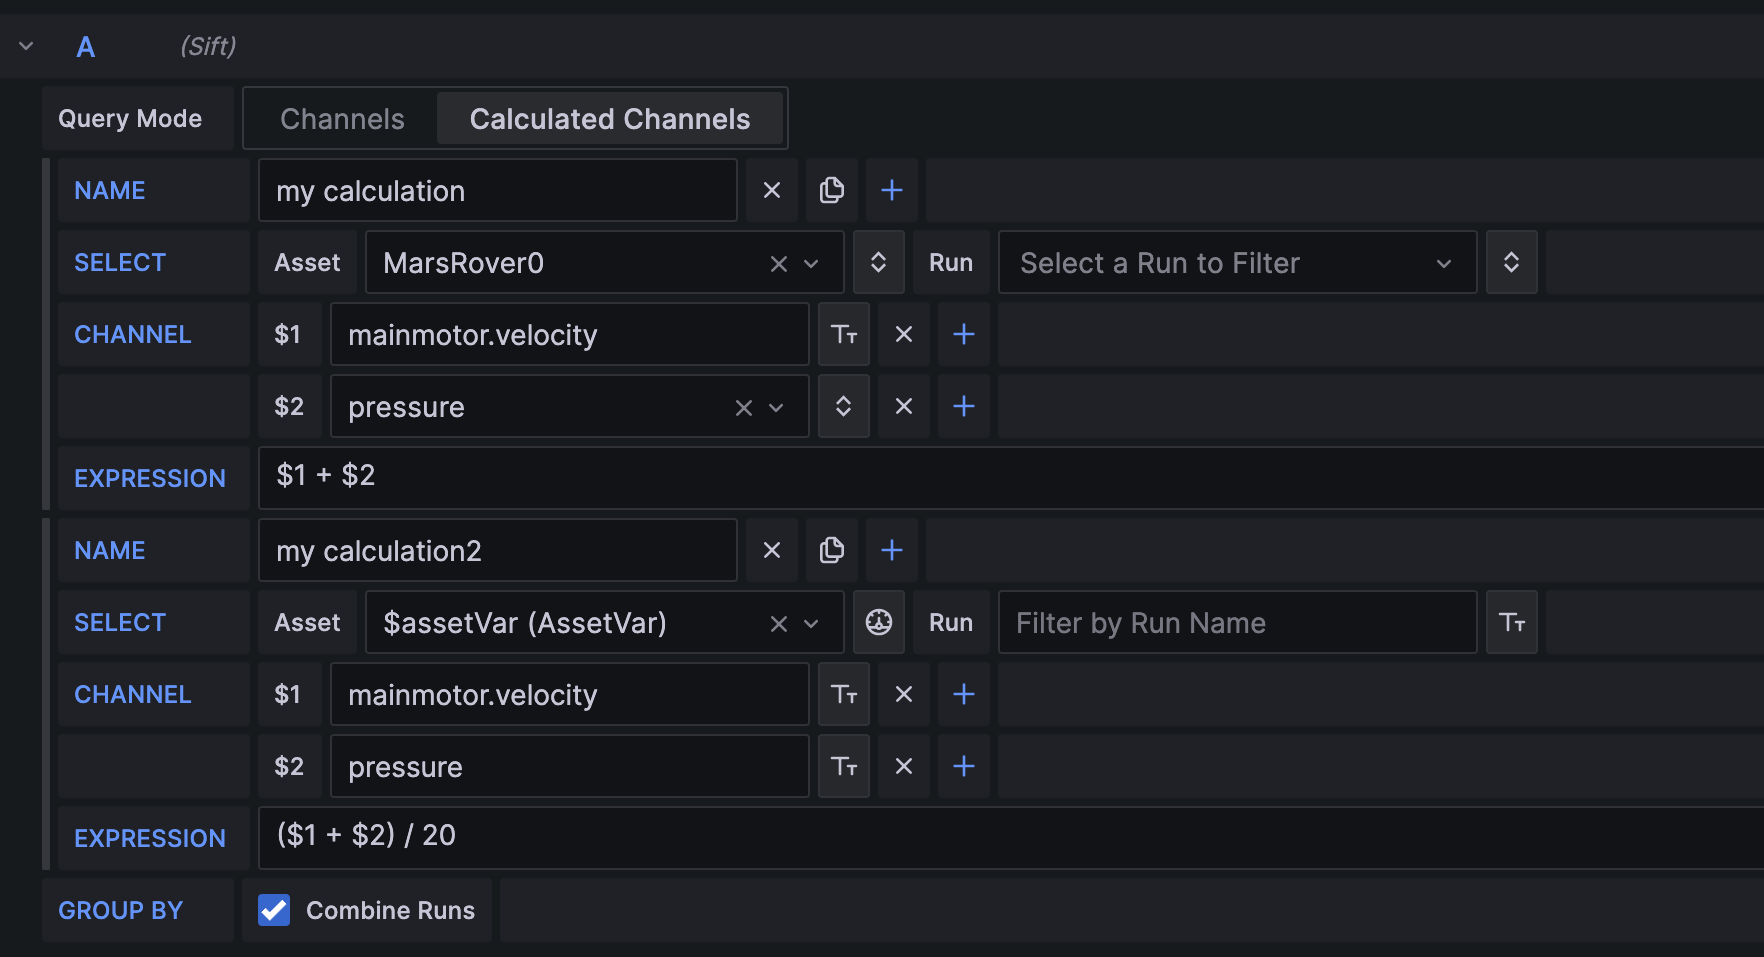
- Click "Add Query" and select either a Channel or Calculated Channel query
- Configure query
- Query will be run after selection or clicking outside the input or by clicking the Refresh button
- Additional Queries can be added using the "Add Query" button to use both Channel and Calculated Channel queries in the same panel
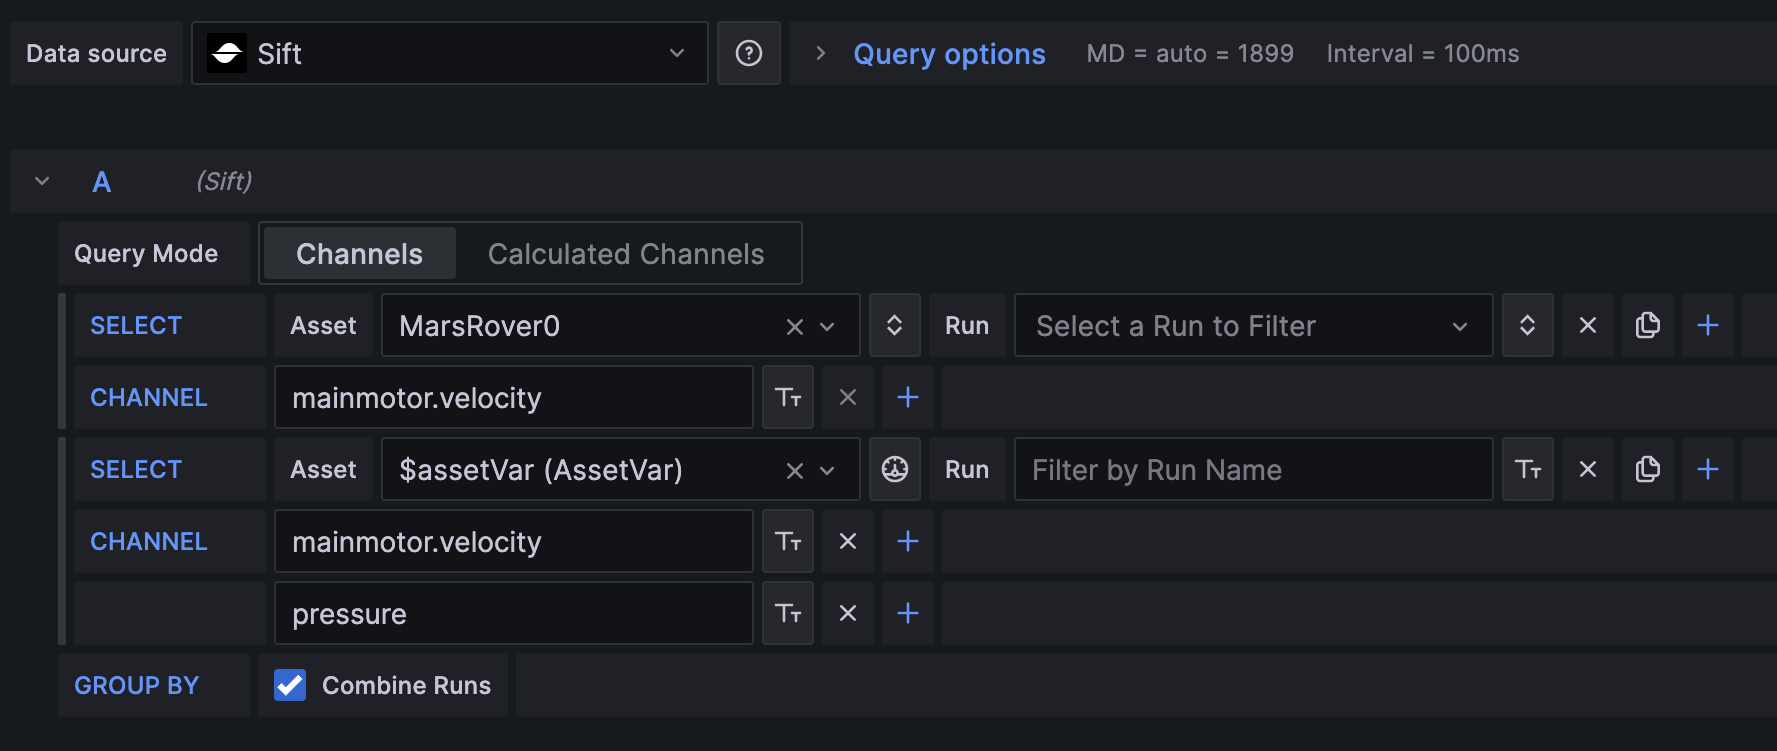
Selection Types
Selection of Assets, Runs, and Channels can be done using multiple different input types. Input type may be changed using the "Change input type" button.
- Selection: Select from a list of options. Filter down the list by entering a search term. Only 200 will be shown at a time and a search may be required to find a specific option.
- Text: Enter the exact name of the Asset, Run, or Channel. This will only return exact matches.
- ID/Client Key: Enter the ID or Client Key of the Asset, Run, or Channel.
- Regex: Enter a regular expression to find multiple Assets, Runs, or Channels by their name. This may return multiple matches. By default, the query is a substring match.
- Grafana Variable Selection: Only available for Assets. Provides a list of Grafana dashboard variables that are Sift Asset Query variables (See below).
Channels and Runs can only use the Selection type when an Asset option has been selected using the Selection dropdown.
Grouping
By default, data is combined from multiple Runs into a single trace. To group by Channel and Run , uncheck "Combine Runs".
Asset Query Variables
Query variables can be used to dynamically select Assets.
To add an Asset selector to your dashboard:
- Go to the Dashboard settings
- Click the "Variables" tab
- Click "New Variable" button
- Select variable type "Query"
- Select Data Source "Sift"
- Configure remaining options to your preference
The dashboard variable will allow for selecting Multiple, All, or a single Asset. The variable can be selected from the dashboard variable selector in the query editor for Asset.
Other Dashboard Variables
Other dashboard variables can be in any text input field such as name, ID, calculated channel name, or expression.
To use a dashboard variable in a query, enter the name as: ${variableName}. The variable will be replaced with
the string value of the variable when the query is executed.
Caching
To improve performance, queries are cached by panel for a given query and associated interval (sample rate). If the query range changes, but the query is otherwise the same, only the missing data on either side will be fetched. In the case where the right side of the query range is close to live, new data will always be queried for data between now and the last 10 minutes.
Asset, Run, and Channel queries are cached to speed up regular expression queries. These caches will expire after 10 minutes.
Both caches may be cleared for a panel by clicking the "Clear cache" button next to the Query Mode selector.
Learn More
Contributing
Please submit bug reports and pull requests to the Sift Grafana Datasource repository on GitHub.