Plugins 〉Discrete


The Discrete plugin has been deprecated and is no longer maintained.
Discrete


Discrete Panel


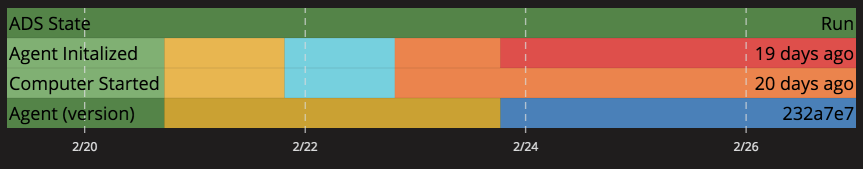
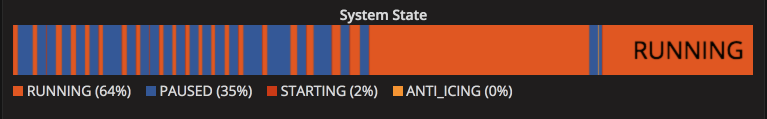
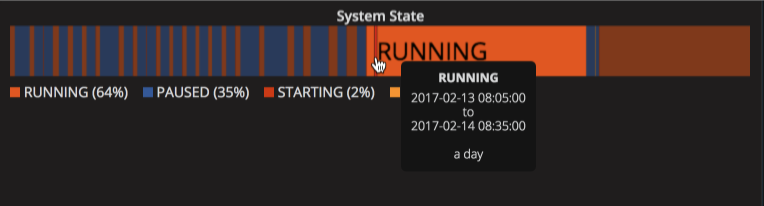
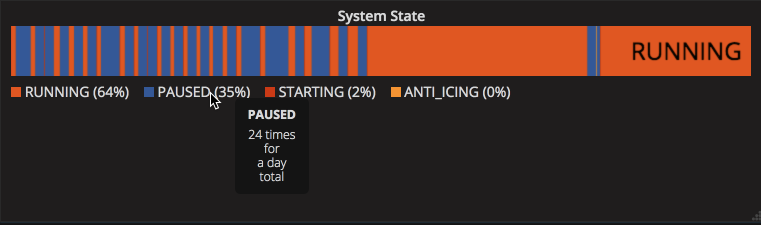
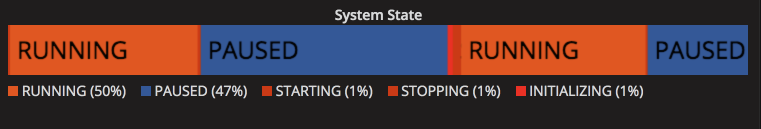
This panel shows discrete values in a horizontal graph. This lets show state transitions clearly. It is a good choice to display string or boolean data
Screenshots
Building
To complie, run:
yarn install
yarn build
Releasing
This plugin uses release-it to release to GitHub.
env GITHUB_TOKEN=your_token yarn release-it patch
Roadmap
- TODO: full annotation support
- TODO: better documentation
- release v1.0
Changelog
v0.1.0
- works with Grafana 7 (naming fixed)
- Building with
@grafana/toolkit - Supports DataFrame directly for 6.4+
v0.0.9
- Remove
distfrom master - Use webpack build
- FIX: Use background color to clear the background
- Configurable duration resolution option (thanks @clink-aaron)
- deploy using release-it
- Don't hide series names on hover
v0.0.8
- Support Snapshots (thanks @londonanthonyoleary)
- Direct link rendered image now works.
- Support UTC date display
- Fix display issue with 5.1
- Merge distinct values in legend unless showing the name
- Basic Annotation Support
- Fix mapping numeric data to text
v0.0.7
- Switch to typescript
- Override applyPanelTimeOverrides rather than issueQueries to extend time
- Support numeric unit conversion
- New rendering pipeline (thanks @jonyrock)
- Don't detect duplicate colors from metrics
- Formatting with prettier.js
- Only hide hover text when it collides
- Show time axis (copied from novatec-grafana-discrete-panel)
- Improved text collision behavior
v0.0.6
- Fix for grafana 4.5 (thanks @alin-amana)
v0.0.5
- Support results from the table format
- Support results in ascending or decending order
- Configure legend percentage decimal points
- Legend can show transition count and distinct value count
- Clamp percentage stats within the query time window
- Changed the grafana dependency version to 4.x.x, since 3.x.x was not really supported
- Fixed issues with tooltip hover position
- Option to expand 'from' query so the inital state can avoid 'null'
v0.0.4
- Support shared tooltips (not just crosshair)
v0.0.3
- Configure more colors (retzkek)
- Fix tooltips (retzkek)
- Configure Text Size
- Support shared crosshair
v0.0.2
- Use the panel time shift.
v0.0.1
- First working version
Grafana Cloud Free
- Free tier: Limited to 3 users
- Paid plans: $55 / user / month above included usage
- Access to all Enterprise Plugins
- Fully managed service (not available to self-manage)
Self-hosted Grafana Enterprise
- Access to all Enterprise plugins
- All Grafana Enterprise features
- Self-manage on your own infrastructure
Install on Grafana Cloud
Plugins can be installed directly from within your Grafana instance or automated using the Cloud API or Terraform.
Learn more about plugin installationMarketplace plugins
This is a paid plugin developed by a marketplace partner. To purchase an entitlement, sign in first, then fill out the contact form.
Get this plugin
This is a paid for plugin developed by a marketplace partner. To purchase entitlement please fill out the contact us form.
What to expect:
- Grafana Labs will reach out to discuss your needs
- Payment will be taken by Grafana Labs
- Once purchased the plugin will be available for you to install (cloud) or a signed version will be provided (on-premise)
Thank you! We will be in touch.
For more information, visit the docs on plugin installation.
Installing on a local Grafana:
For local instances, plugins are installed and updated via a simple CLI command. Plugins are not updated automatically, however you will be notified when updates are available right within your Grafana.
1. Install the Panel
Use the grafana-cli tool to install Discrete from the commandline:
grafana-cli plugins install The plugin will be installed into your grafana plugins directory; the default is /var/lib/grafana/plugins. More information on the cli tool.
Alternatively, you can manually download the .zip file for your architecture below and unpack it into your grafana plugins directory.
Alternatively, you can manually download the .zip file and unpack it into your grafana plugins directory.
2. Add the Panel to a Dashboard
Installed panels are available immediately in the Dashboards section in your Grafana main menu, and can be added like any other core panel in Grafana.
To see a list of installed panels, click the Plugins item in the main menu. Both core panels and installed panels will appear.
Changelog
v0.1.1
- Added MANIFEST
v0.1.0
- works with Grafana 7 (naming fixed)
- Building with
@grafana/toolkit - Supports DataFrame directly for 6.4+
v0.0.9
- Remove
distfrom master - Use webpack build
- FIX: Use background color to clear the background
- Configurable duration resolution option (thanks @clink-aaron)
- deploy using release-it
- Don't hide series names on hover
v0.0.8
- Support Snapshots (thanks @londonanthonyoleary)
- Direct link rendered image now works.
- Support UTC date display
- Fix display issue with 5.1
- Merge distinct values in legend unless showing the name
- Basic Annotation Support
- Fix mapping numeric data to text
v0.0.7
- Switch to typescript
- Override applyPanelTimeOverrides rather than issueQueries to extend time
- Support numeric unit conversion
- New rendering pipeline (thanks @jonyrock)
- Don't detect duplicate colors from metrics
- Formatting with prettier.js
- Only hide hover text when it collides
- Show time axis (copied from novatec-grafana-discrete-panel)
- Improved text collision behavior
v0.0.6
- Fix for grafana 4.5 (thanks @alin-amana)
v0.0.5
- Support results from the table format
- Support results in ascending or decending order
- Configure legend percentage decimal points
- Legend can show transition count and distinct value count
- Clamp percentage stats within the query time window
- Changed the grafana dependency version to 4.x.x, since 3.x.x was not really supported
- Fixed issues with tooltip hover position
- Option to expand 'from' query so the inital state can avoid 'null'
v0.0.4
- Support shared tooltips (not just crosshair)
v0.0.3
- Configure more colors (retzkek)
- Fix tooltips (retzkek)
- Configure Text Size
- Support shared crosshair
v0.0.2
- Use the panel time shift.
v0.0.1
- First working version