
Plugins 〉HeatmapEpoch


HeatmapEpoch

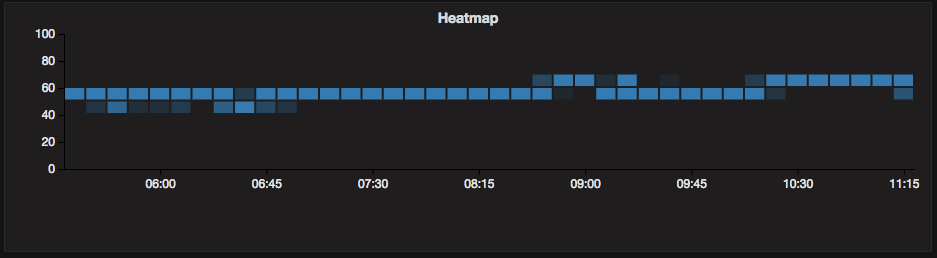
Heatmap (Epoch) Panel Plugin for Grafana
Caution: This plugin is NOT stable yet, if you find some bugs, please report me :-)
This plugin show the Heatmap of time series data.
How this plugin works
This plugin receives raw time series data, and convert the data to heatmap data in plugin side, and then show it by Epoch.
To make heatmap data, make histogram data in fixed short time range. The aggregation time range is calculated from Epoch window size options, please calibrate the option to fit your needs.
Supported Datasources
I confirmed this plugin work with following datasource.
- Prometheus
But, this plugin can handle time series data (defined by Grafana plugin interface).
Should work with Graphite / InfluxDB / OpenTSDB.
Options
Support some of Epoch options.
- Window Size
- Buckets
- BucketLower and BuckerUpper (correspond to bucketRange)
Please read official document, to get to know actual meaning of these options.
Known Issues
This plugin doesn't support Elasticsearch aggregation.
- As noted above, this plugin aggregate the time series data by plugin itself.
- Can't handle the Elasticsearch aggregation result yet.
This plugin doesn't support some of Graph panel feature.
- Because Epoch library doesn't support some of Flot library feature (Graph panel use Flot)
- Doesn't support Time range selection by clicking panel, Tooltip, Annotation, Draw threshold lines, etc...
Changelog
v0.1.7
- Increase the supported number of time series
v0.1.6
- Add auto bucket range mode
v0.1.5
- Fixed user preference timezone handling
v0.1.4
- Fixed sparse data handling
- Fixed heatmap color, follow Grafana standard color
- Fixed legend drawing
v0.1.3
- Added support legend
v0.1.2
- Added support theme
- Fixed axis character colors
- Fixed time axis, make it more intuitive
v0.1.1
- Fixed container resize handling, redraw graph to fit container size
- Fixed ticks, show ticks like graph panel
Grafana Cloud Free
- Free tier: Limited to 3 users
- Paid plans: $55 / user / month above included usage
- Access to all Enterprise Plugins
- Fully managed service (not available to self-manage)
Self-hosted Grafana Enterprise
- Access to all Enterprise plugins
- All Grafana Enterprise features
- Self-manage on your own infrastructure
Installing HeatmapEpoch on Grafana Cloud:
Installing plugins on a Grafana Cloud instance is a one-click install; same with updates. Cool, right?
Note that it could take up to 1 minute to see the plugin show up in your Grafana.
Warning
Plugin installation from this page will be removed in February 2026. Use the Plugin Catalog in your Grafana instance instead. Refer to Install a plugin in the Grafana documentation for more information.
Installing plugins on a Grafana Cloud instance is a one-click install; same with updates. Cool, right?
Note that it could take up to 1 minute to see the plugin show up in your Grafana.
Installing plugins on a Grafana Cloud instance is a one-click install; same with updates. Cool, right?
Note that it could take up to 1 minute to see the plugin show up in your Grafana.
Warning
Plugin installation from this page will be removed in February 2026. Use the Plugin Catalog in your Grafana instance instead. Refer to Install a plugin in the Grafana documentation for more information.
Installing plugins on a Grafana Cloud instance is a one-click install; same with updates. Cool, right?
Note that it could take up to 1 minute to see the plugin show up in your Grafana.
For more information, visit the docs on plugin installation.
Installing on a local Grafana:
For local instances, plugins are installed and updated via a simple CLI command. Plugins are not updated automatically, however you will be notified when updates are available right within your Grafana.
1. Install the Panel
Use the grafana-cli tool to install HeatmapEpoch from the commandline:
grafana-cli plugins install The plugin will be installed into your grafana plugins directory; the default is /var/lib/grafana/plugins. More information on the cli tool.
Alternatively, you can manually download the .zip file for your architecture below and unpack it into your grafana plugins directory.
Alternatively, you can manually download the .zip file and unpack it into your grafana plugins directory.
2. Add the Panel to a Dashboard
Installed panels are available immediately in the Dashboards section in your Grafana main menu, and can be added like any other core panel in Grafana.
To see a list of installed panels, click the Plugins item in the main menu. Both core panels and installed panels will appear.