
Plugins 〉Indoor air quality floor plan


Indoor air quality floor plan


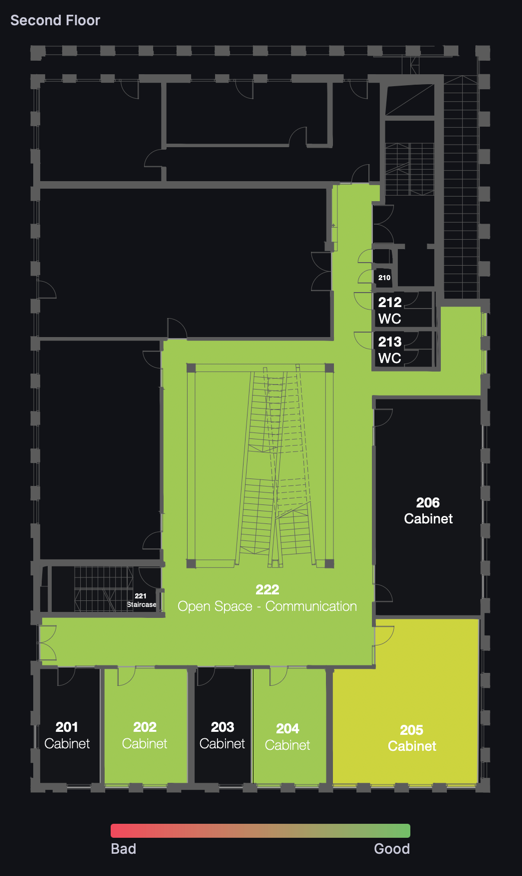
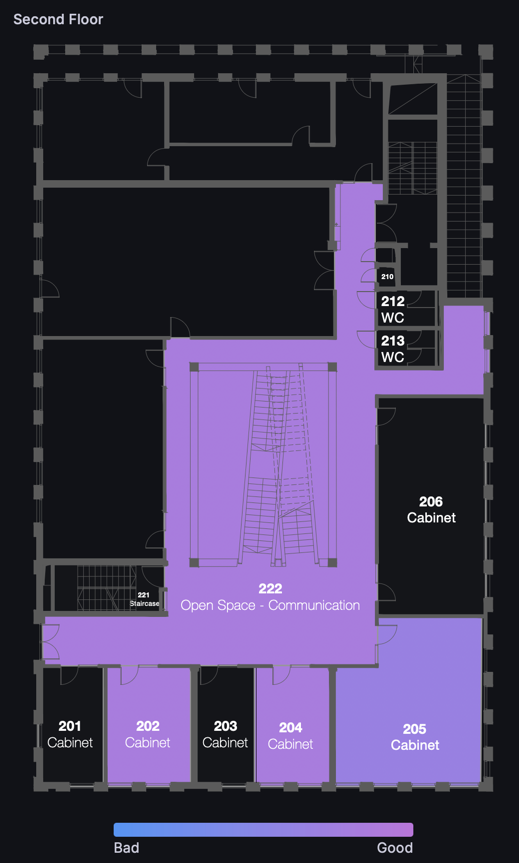
Floor Plan Indoor Air Quality monitoring
(soon interactive)
Features
- Air Quality rendering
- Easy configuration and setup
- Interactive rooms
- Detailed charts of IAQ history.
Short description
Monitoring indoor air quality through floor plan visualization in Grafana using Flux query language allows for gaining valuable insights into the air quality of different areas within a building. By integrating sensors and data collection points throughout the building, Grafana can display real-time and historical air quality data on a floor plan layout. This enables users to easily identify areas with poor air quality and take appropriate actions to improve it, such as adjusting ventilation systems or implementing air purifiers. Overall, this approach enhances indoor air quality management and contributes to creating healthier and more comfortable environments for occupants.
The plugin finds rooms in the provided floor plan SVG by looking for prefix of room: (example: room:Living room) and in the future walls with the prefix of wall: (example: wall:south-east).
Public Dashboard Example
Required Data Example (CSV)
#group,false,false,false,false,false,true
#datatype,string,long,string,dateTime:RFC3339,string,string
#default,_result,,,,,
,result,table,_field,_time,_value,sensor_id
,,0,RH,2024-06-03T07:06:00Z,59.89,411
,,0,abs_humidity,2024-06-03T07:06:00Z,12.41,411
,,0,co2,2024-06-03T07:06:00Z,500.48,411
,,0,dew_point,2024-06-03T07:06:00Z,14.96,411
,,0,luminance,2024-06-03T07:06:00Z,40.43,411
,,0,temperature,2024-06-03T07:06:00Z,23.19,411
,,0,voc_eq_co2,2024-06-03T07:06:00Z,577.68,411
,,0,voc_index,2024-06-03T07:06:00Z,577.68,411
,,1,RH,2024-06-03T07:06:00Z,53.0938,ir-00
,,1,abs_humidity,2024-06-03T07:06:00Z,12.3588,ir-00
,,1,co2,2024-06-03T07:06:00Z,504.1678,ir-00
,,1,dew_point,2024-06-03T07:06:00Z,15.0008,ir-00
,,1,luminance,2024-06-03T07:06:00Z,297.5616,ir-00
,,1,temperature,2024-06-03T07:06:00Z,25.2382,ir-00
,,1,turned_on,2024-06-03T07:06:00Z,17091208,ir-00
,,1,voc_acc,2024-06-03T07:06:00Z,NULL,ir-00
,,1,voc_eq_co2,2024-06-03T07:06:00Z,665,ir-00
,,1,voc_index,2024-06-03T07:06:00Z,665,ir-00
,,2,RH,2024-06-03T07:06:00Z,47.0603,ir-01
,,2,abs_humidity,2024-06-03T07:06:00Z,11.5456,ir-01
,,2,co2,2024-06-03T07:06:00Z,419.7745,ir-01
,,2,dew_point,2024-06-03T07:06:00Z,13.9951,ir-01
,,2,luminance,2024-06-03T07:06:00Z,16.1856,ir-01
,,2,temperature,2024-06-03T07:06:00Z,26.1782,ir-01
,,2,turned_on,2024-06-03T07:06:00Z,19316144,ir-01
,,2,voc_acc,2024-06-03T07:06:00Z,NULL,ir-01
,,2,voc_eq_co2,2024-06-03T07:06:00Z,488,ir-01
,,2,voc_index,2024-06-03T07:06:00Z,488,ir-01
,,3,RH,2024-06-03T07:06:00Z,47.2755,ir-02
,,3,abs_humidity,2024-06-03T07:06:00Z,11.1204,ir-02
,,3,co2,2024-06-03T07:06:00Z,425.1092,ir-02
,,3,dew_point,2024-06-03T07:06:00Z,13.3786,ir-02
,,3,luminance,2024-06-03T07:06:00Z,0,ir-02
,,3,temperature,2024-06-03T07:06:00Z,25.4251,ir-02
,,3,turned_on,2024-06-03T07:06:00Z,12344016,ir-02
,,3,voc_acc,2024-06-03T07:06:00Z,NULL,ir-02
,,3,voc_eq_co2,2024-06-03T07:06:00Z,698,ir-02
,,3,voc_index,2024-06-03T07:06:00Z,698,ir-02
,,4,RH,2024-06-03T07:06:00Z,57.1145,ir-03
,,4,abs_humidity,2024-06-03T07:06:00Z,12.2462,ir-03
,,4,co2,2024-06-03T07:06:00Z,474.4346,ir-03
,,4,dew_point,2024-06-03T07:06:00Z,14.7826,ir-03
,,4,luminance,2024-06-03T07:06:00Z,36.288,ir-03
,,4,temperature,2024-06-03T07:06:00Z,23.7829,ir-03
,,4,turned_on,2024-06-03T07:06:00Z,1522037,ir-03
,,4,voc_acc,2024-06-03T07:06:00Z,NULL,ir-03
,,4,voc_eq_co2,2024-06-03T07:06:00Z,540,ir-03
,,4,voc_index,2024-06-03T07:06:00Z,540,ir-03
,,5,RH,2024-06-03T07:06:00Z,56.2478,ir-04
,,5,abs_humidity,2024-06-03T07:06:00Z,11.8319,ir-04
,,5,co2,2024-06-03T07:06:00Z,676.0902,ir-04
,,5,dew_point,2024-06-03T07:06:00Z,14.2318,ir-04
,,5,luminance,2024-06-03T07:06:00Z,26.8416,ir-04
,,5,temperature,2024-06-03T07:06:00Z,23.4464,ir-04
,,5,turned_on,2024-06-03T07:06:00Z,5754636,ir-04
,,5,voc_acc,2024-06-03T07:06:00Z,NULL,ir-04
,,5,voc_eq_co2,2024-06-03T07:06:00Z,431,ir-04
,,5,voc_index,2024-06-03T07:06:00Z,431,ir-04
,,6,RH,2024-06-03T07:06:00Z,63.9078,ir-06
,,6,abs_humidity,2024-06-03T07:06:00Z,12.1686,ir-06
,,6,co2,2024-06-03T07:06:00Z,431.7405,ir-06
,,6,dew_point,2024-06-03T07:06:00Z,14.5753,ir-06
,,6,luminance,2024-06-03T07:06:00Z,3.2832,ir-06
,,6,temperature,2024-06-03T07:06:00Z,21.708,ir-06
,,6,turned_on,2024-06-03T07:06:00Z,23495992,ir-06
,,6,voc_acc,2024-06-03T07:06:00Z,NULL,ir-06
,,6,voc_eq_co2,2024-06-03T07:06:00Z,457,ir-06
,,6,voc_index,2024-06-03T07:06:00Z,457,ir-06
,,7,RH,2024-06-03T07:06:00Z,57.4838,ir-07
,,7,abs_humidity,2024-06-03T07:06:00Z,11.7847,ir-07
,,7,co2,2024-06-03T07:06:00Z,433.5116,ir-07
,,7,dew_point,2024-06-03T07:06:00Z,14.1465,ir-07
,,7,luminance,2024-06-03T07:06:00Z,5.3568,ir-07
,,7,temperature,2024-06-03T07:06:00Z,22.9951,ir-07
,,7,turned_on,2024-06-03T07:06:00Z,19316228,ir-07
,,7,voc_acc,2024-06-03T07:06:00Z,NULL,ir-07
,,7,voc_eq_co2,2024-06-03T07:06:00Z,464,ir-07
,,7,voc_index,2024-06-03T07:06:00Z,464,ir-07
Data should be grouped as
<sensor_id, <_field, _time, _value, sensor_id>>
A flux example query would be
from(bucket: "iaq")
  |> range(start: v.timeRangeStart, stop: v.timeRangeStop)
  |> filter(fn: (r) => r["_measurement"] == "iaq_data")
  |> map(fn: (r) => ({r with _value: string(v:r._value)}))
  |> truncateTimeColumn(unit: 2m)
  |> last()
  |> group(columns: ["sensor_id"])
  |> drop(columns: ["_start", "_stop", "_measurement", "building"])
Sample Floor plan SVG Data
https://github.com/InnoRenew-CoE/grafana-floor-panel/blob/main/floor_plan.svg
Note:
The plugin is not yet signed and is not available through the grafana store.
Grafana Cloud Free
- Free tier: Limited to 3 users
- Paid plans: $55 / user / month above included usage
- Access to all Enterprise Plugins
- Fully managed service (not available to self-manage)
Self-hosted Grafana Enterprise
- Access to all Enterprise plugins
- All Grafana Enterprise features
- Self-manage on your own infrastructure
Installing Indoor air quality floor plan on Grafana Cloud:
Installing plugins on a Grafana Cloud instance is a one-click install; same with updates. Cool, right?
Note that it could take up to 1 minute to see the plugin show up in your Grafana.
Warning
Plugin installation from this page will be removed in February 2026. Use the Plugin Catalog in your Grafana instance instead. Refer to Install a plugin in the Grafana documentation for more information.
Installing plugins on a Grafana Cloud instance is a one-click install; same with updates. Cool, right?
Note that it could take up to 1 minute to see the plugin show up in your Grafana.
Installing plugins on a Grafana Cloud instance is a one-click install; same with updates. Cool, right?
Note that it could take up to 1 minute to see the plugin show up in your Grafana.
Warning
Plugin installation from this page will be removed in February 2026. Use the Plugin Catalog in your Grafana instance instead. Refer to Install a plugin in the Grafana documentation for more information.
Installing plugins on a Grafana Cloud instance is a one-click install; same with updates. Cool, right?
Note that it could take up to 1 minute to see the plugin show up in your Grafana.
For more information, visit the docs on plugin installation.
Installing on a local Grafana:
For local instances, plugins are installed and updated via a simple CLI command. Plugins are not updated automatically, however you will be notified when updates are available right within your Grafana.
1. Install the Panel
Use the grafana-cli tool to install Indoor air quality floor plan from the commandline:
grafana-cli plugins install The plugin will be installed into your grafana plugins directory; the default is /var/lib/grafana/plugins. More information on the cli tool.
Alternatively, you can manually download the .zip file for your architecture below and unpack it into your grafana plugins directory.
Alternatively, you can manually download the .zip file and unpack it into your grafana plugins directory.
2. Add the Panel to a Dashboard
Installed panels are available immediately in the Dashboards section in your Grafana main menu, and can be added like any other core panel in Grafana.
To see a list of installed panels, click the Plugins item in the main menu. Both core panels and installed panels will appear.
Changelog
1.0.0 (Unreleased)
Initial release.