Plugins 〉AWS Application Signals


Developer

Grafana

Sign up to receive occasional product news and updates:


Grafana Cloud
Grafana Cloud
  • Grafana, of course
  • 10k series Prometheus metrics
  • 50 GB logs
  • 50 GB traces
  • 2,232 app o11y host hours
  • ...and more
Create free account

No credit card needed, ever.


Data Source
grafana

AWS Application Signals

  • Overview
  • Installation
  • Change log
  • Related content

Compatibility

Grafana AWS Application Signals data source plugin >=2.13.0 is not compatible with Grafana versions <10.4.x due to a breaking change in UI components.

Application Signals data source

The Application Signals data source plugin provides a support for AWS Application Signals and AWS X-Ray Traces. This data source was formerly named the AWS X-Ray data source plugin. Add it as a data source, then you are ready to build dashboards or use Explore with Application Signals to look at traces, analytics, or insights.

Add the data source

  1. In the side menu under the Configuration link, click on Data Sources.
  2. Click the Add data source button.
  3. Select Application Signals in the Distributed tracing section.

Note: If you have issues getting this data source to work and Grafana is giving you undescriptive errors, check your log file (/var/log/grafana/grafana.log).

NameDescription
NameThe data source name. This is how you refer to the data source in panels and queries.
DefaultDefault data source means that it will be pre-selected for new panels.
Default RegionUsed in query editor to set region. (can be changed on per query basis)
Auth ProviderSpecify the provider to get credentials.
Credentials profile nameSpecify the name of the profile to use (if you use ~/.aws/credentials file), leave blank for default.
Assume Role ArnSpecify the ARN of the role to assume.
External IDIf you are assuming a role in another account that was created with an external ID, specify the external ID here.

Authentication

This section describes the different type of authentication you can use for the AWS Application Signals data source.

IAM Roles

All access to Application Signals is done server-side by the Grafana backend using the official AWS SDK. If your Grafana server is running on AWS you can use IAM Roles and authentication will be handled automatically.

See the AWS documentation on IAM Roles

Note: AWS Role Switching is not currently supported.

IAM Policies

Grafana needs permissions granted via IAM to be able to read X-Ray data and EC2 tags/instances/regions. You can attach these permissions to IAM roles and utilize Grafana's built-in support for assuming roles.

Here is a basic policy example:

{
  "Version": "2012-10-17",
  "Statement": [
    {
      "Sid": "XrayPermissions",
      "Effect": "Allow",
      "Action": [
        "xray:BatchGetTraces",
        "xray:GetTraceSummaries",
        "xray:GetTraceGraph",
        "xray:GetGroups",
        "xray:GetTimeSeriesServiceStatistics",
        "xray:GetInsightSummaries",
        "xray:GetInsight",
        "xray:GetServiceGraph",
        "ec2:DescribeRegions"
      ],
      "Resource": "*"
    },
    {
      "Sid": "ApplicationSignalsPermissions",
      "Effect": "Allow",
      "Action": [
        "application-signals:ListServiceLevelObjectives",
        "application-signals:ListServiceDependencies",
        "application-signals:ListServiceOperations",
        "application-signals:ListServices"
      ],
      "Resource": "*"
    }
  ]
}

Example AWS credentials

If the Auth Provider is Credentials file, Grafana tries to obtain credentials in the following order:

  • Hard-code credentials
  • Environment variables (AWS_ACCESS_KEY_ID and AWS_SECRET_ACCESS_KEY)
  • Existing default config files
  • ~/.aws/credentials
  • IAM role for Amazon EC2

See Configuring the AWS SDK for Go in the AWS documentation for more information.

AWS credentials file

Create a file at ~/.aws/credentials. That is the HOME path for users running grafana-server.

Note: If the credentials file is in the correct directory, but it is not working, try moving your .aws file to '/usr/share/grafana/'. Make sure your credentials file has at most 0644 permissions.

Example credential file:

[default]
aws_access_key_id = <your access key>
aws_secret_access_key = <your access key>
region = us-west-2

Query editor

There are two query modes, Traces and Services.

Traces queries

There are five X-Ray Traces query types:

  • Trace List (Traces in AWS)
  • Trace Statistics
  • Trace Analytics (Analytics in AWS)
  • Insights
  • Service map

x-ray-query-editor

Trace List

The Trace List type allows you to search for traces which are shown in a table. Clicking on the trace id in the first column opens the trace on the right side. Notice the query field in the editor. You can write queries, filter expressions, or insert a single trace ID that will be shown in a trace view. You can find more detail about filter expressions in AWS X-Ray Traces documentation.

x-ray-trace-list

Note: The Trace List will only show the first 1000 traces.
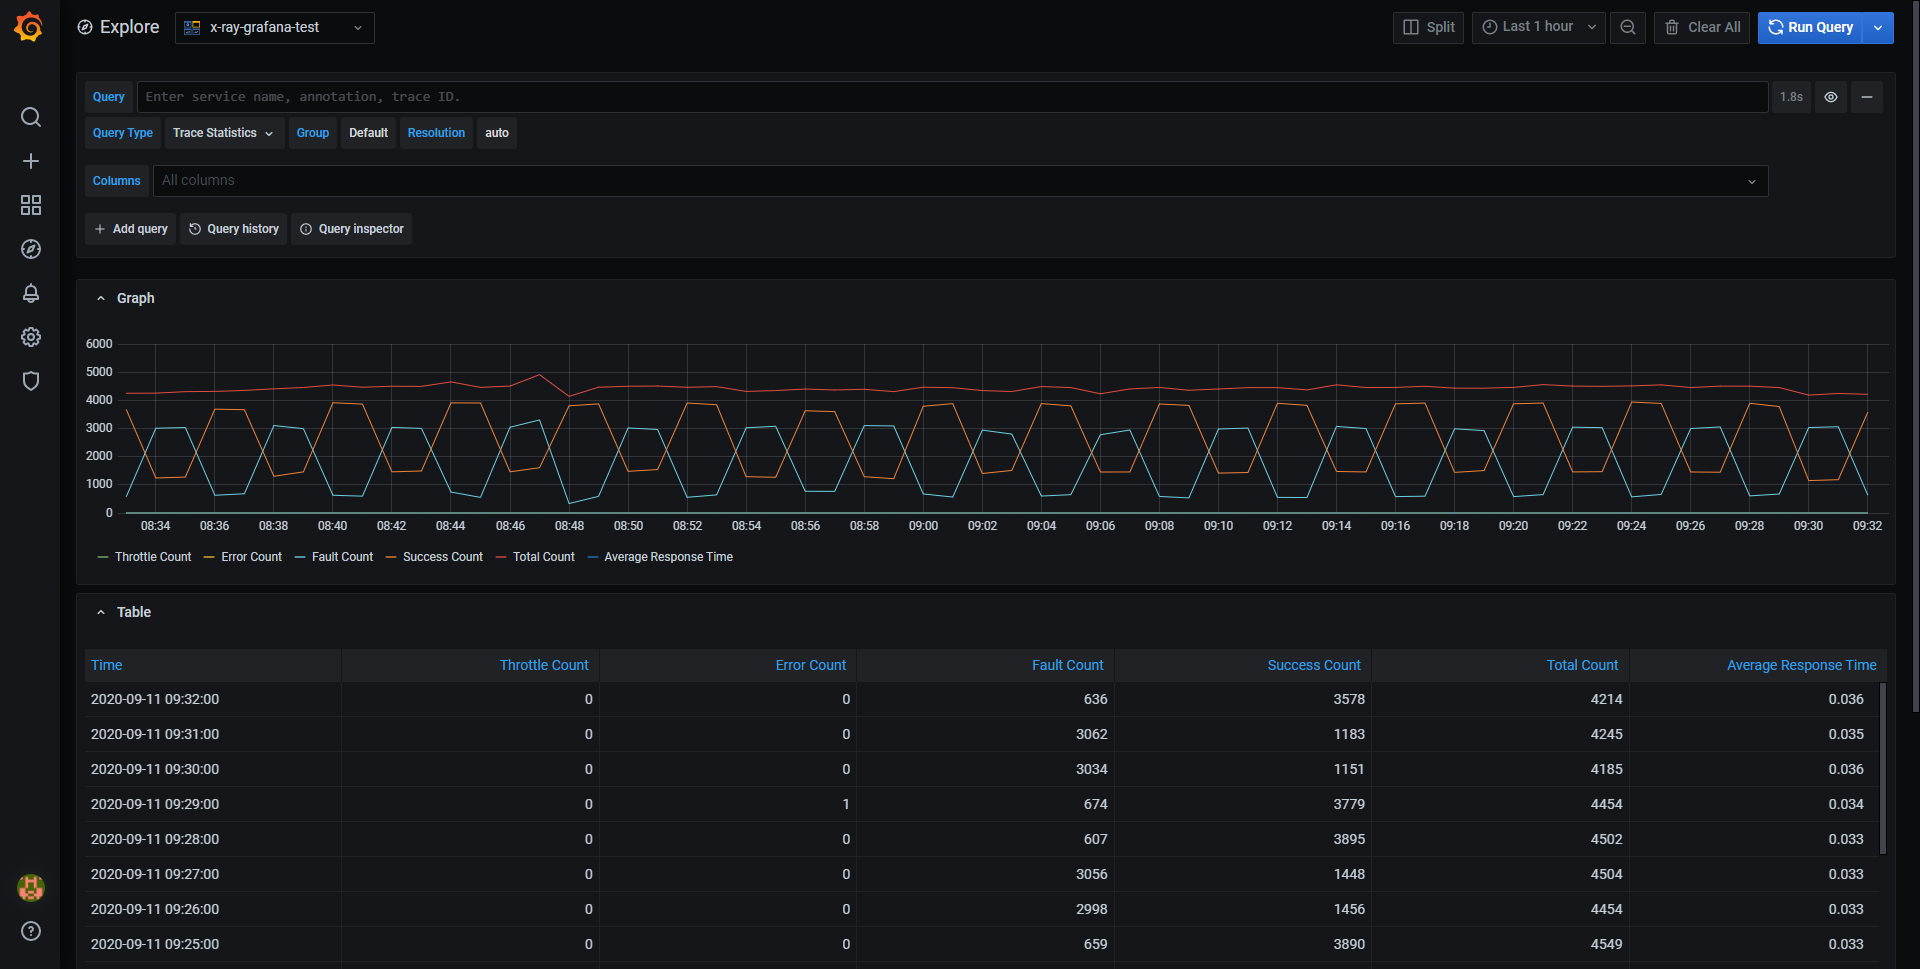
Trace Statistics

In Trace Statistics you can see a graph and a table showing information about error, fault, throttle, success, and total count. You can use the columns field in the query editor to only see specified columns.

x-ray-trace-statistics

Trace Analytics

In Trace Analytics you can visualize the following tables:

  • Root Cause
    • Response Time
      • Root Cause Service (Last service in path)
      • Path (multiple paths)
    • Error
      • Root Cause Service (Last service in path)
      • Path
      • Error Message
    • Fault
      • Root Cause Service (Last service in path)
      • Path
      • Error Message
  • End user Impact
  • URL
  • HTTP Status Code

Insights

In Insights you can see the summary table for Insights. Clicking the InsightId will take you to AWS console.

Service map

Service map in Grafana enables customers to view a map of their applications built using microservices architecture. Each node on the map represents a service such as an AWS Lambda function or an API running on an API Gateway or DynamoDB table. With this map, customers can easily detect performance issues, or increase in error, fault or throttle rates in any of their services and dive deep into corresponding traces and root cause.

Service map

The Service Map query type shows the same data as a Trace Map inside the Application Signals console.

To display the service map:

  • Use the Node graph panel visualization. For details on how to navigate the visualization, see Node graph panel navigation.
  • Show the data in a simple table. This is the only option if the Node graph panel is unavailable.

Service map navigation

Similar to Trace Map root nodes, nodes in the service map representing the client application are on the left side of the map.

Each service in the map is represented as a circle. Numbers on the inside shows average time per transaction and transactions per minute.

A colored circle around the service also matches colors and meaning from Application Signals console representing percentage of requests.

  • green = success
  • red = fault
  • yellow = errors
  • purple = throttled responses

Click on the service or the edge to see a context menu with links additional links for quick navigation to other relevant information from Application Signals. You can use the links to quickly navigate to a list of all error traces for a particular service and then continue to specific trace.

For more information about Service map, refer to the official AWS X-ray documentation.

Alerting

Since Traces queries can return numeric data, alerts are supported. See the Alerting documentation for more on Grafana alerts.

Service queries

Service Queries allow you to fetch the services in your application to monitor current application health and long term performance.

The data source comes with the Application Signals: Services dashboard, which can be imported and is set up to fetch Services and the accompanied metrics for user selected Application Signals and CloudWatch data sources.

There are 4 service query types:

  • List Services
  • List Service Operations
  • List Service Dependencies
  • List Service Level Objectives (SLO)

List Services

List Services returns a table of the services in your Application Signals datasource.

List Service Operations

List Service Operations returns a table of the CloudWatch Metrics for the service operations for a selected service.

List Service Dependencies

List Service Dependencies returns a table of the CloudWatch Metrics for the service dependencies for a selected service.

List Service Level Objectives (SLO)

List Service Operations returns a table of the SLOs for a selected service operation.

Application Signals: Services dashboard

The Application Signals: Services dashboard can be imported from the datasource and is set up to fetch Services and the accompanied metrics for user selected Application Signals and CloudWatch data sources. This dashboard allows you to select Services, Service Operations, and Service Dependencies to display the associated CloudWatch metrics.

To use this board you must have Application Signals enabled in your CloudWatch account and select the appropriate Application Signals and CloudWatch data sources and region in the dashboard variables.

More information about Application Signals and enabling it in AWS can be found in the AWS docs.

Pricing

With AWS X-Ray, there are no upfront fees or commitments. You pay only for what you use, based on the number of traces recorded, retrieved, and scanned. The first 1,000,000 traces retrieved or scanned each month are free. Beyond the free tier, traces scanned cost $0.50 per 1 million traces scanned ($0.0000005 per trace).

With AWS Application Signals the first 3 months of usage for each account are free or the limit is hit:

  • 100GB data ingested for Application Signals including complete visibility into application transaction spans
  • 100 million Signals for Application Signals with no visibility into application transaction spans

Refer to the CloudWatch pricing page for more details on the pricing for these APIs.

Configure the data source with provisioning

You can configure data sources using config files with Grafana's provisioning system. For more information regarding how it works and all available settings, see Provision Grafana.

Here are some provisioning examples for this data source.

Using a credentials file

If you are using the Credentials file authentication type, use a config similar to this:

apiVersion: 1
datasources:
  • name: Application Signals type: grafana-x-ray-datasource jsonData: authType: credentials defaultRegion: eu-west-2

Using accessKey and secretKey

apiVersion: 1
datasources:
  • name: Application Signals type: grafana-x-ray-datasource jsonData: authType: keys defaultRegion: eu-west-2 secureJsonData: accessKey: ‘<your access key>secretKey: ‘<your secret key>

Cross-Account Observability

The Application Signals plugin allows you to monitor traces across multiple AWS accounts within a region with the Cross-Account Observability feature. Using cross-account observability, you can seamlessly search, visualize and analyze AWS traces without worrying about account boundaries.

Getting started

To enable cross-account observability, first enable the feature in AWS using the official CloudWatch docs, then add

{
  "Version": "2012-10-17",
  "Statement": [
    {
      "Action": ["oam:ListSinks", "oam:ListAttachedLinks"],
      "Effect": "Allow",
      "Resource": "*"
    }
  ]
}

to the IAM policy attached to the role/user running the plugin.

Filtering Traces by Account Id

Once the feature is enabled, you will be able to display traces across multiple accounts and filter those traces by account ID. When you select the Service Map query type in Grafana, an account dropdown displays and populates with the account IDs shown in the traces returned in the selected time frame.

You can also add account ID as part of a query filter expression in the Trace List query type.

Installing AWS Application Signals on Grafana Cloud:

For more information, visit the docs on plugin installation.

Installing on a local Grafana:

For local instances, plugins are installed and updated via a simple CLI command. Plugins are not updated automatically, however you will be notified when updates are available right within your Grafana.

1. Install the Data Source

Use the grafana-cli tool to install AWS Application Signals from the commandline:

grafana-cli plugins install 

The plugin will be installed into your grafana plugins directory; the default is /var/lib/grafana/plugins. More information on the cli tool.

2. Configure the Data Source

Accessed from the Grafana main menu, newly installed data sources can be added immediately within the Data Sources section.

Next, click the Add data source button in the upper right. The data source will be available for selection in the Type select box.

To see a list of installed data sources, click the Plugins item in the main menu. Both core data sources and installed data sources will appear.

Change Log

All notable changes to this project will be documented in this file.

2.16.1

  • Chore: Use CI/CD actions for e2e and update grafana version in plugin.json by @idastambuk in https://github.com/grafana/x-ray-datasource/pull/421
  • Chore: Update contributing and readme by @idastambuk in https://github.com/grafana/x-ray-datasource/pull/422
  • Chore: Add downstream error for unsupported query types by @ktw4071 in https://github.com/grafana/x-ray-datasource/pull/428
  • Tweak dependabot schedule in #432
  • Dependencies: Bump grafana dependencies and run create-plugin update in #429
  • Bump eslint from 9.27.0 to 9.30.1 in #418
  • Bump eslint-config-prettier from 10.1.5 to 10.1.8 in #415
  • Bump webpack from 5.99.9 to 5.100.1 in #423
  • Bump @types/node from 22.16.4 to 22.16.5 in #430
  • Bump @grafana/eslint-config from 8.0.0 to 8.1.0 in #416

2.16.0

  • Chore: Migrate to Github actions by @idastambuk in https://github.com/grafana/x-ray-datasource/pull/370
  • Add variable editor for service variables by @iwysiu in https://github.com/grafana/x-ray-datasource/pull/373
  • Remove Group variable until it is properly supported by @iwysiu in https://github.com/grafana/x-ray-datasource/pull/378
  • Service Queries: Update queries to return dimensions correctly by @iwysiu in https://github.com/grafana/x-ray-datasource/pull/376
  • Remove pr_commands by @kevinwcyu in https://github.com/grafana/x-ray-datasource/pull/379
  • Add support for auto-merging dependabot updates, by @kevinwcyu in https://github.com/grafana/x-ray-datasource/pull/371
  • Bump golang.org/x/text from 0.25.0 to 0.26.0 by @dependabot[bot] in https://github.com/grafana/x-ray-datasource/pull/386
  • Bump sass from 1.89.0 to 1.89.2 by @dependabot[bot] in https://github.com/grafana/x-ray-datasource/pull/387
  • Bump eslint-webpack-plugin from 5.0.1 to 5.0.2 by @dependabot[bot] in https://github.com/grafana/x-ray-datasource/pull/391
  • Bump glob from 11.0.2 to 11.0.3 by @dependabot[bot] in https://github.com/grafana/x-ray-datasource/pull/388
  • Bump the grafana-dependencies group with 4 updates by @dependabot[bot] in https://github.com/grafana/x-ray-datasource/pull/389
  • Rename plugin from X-Ray to App Signals by @iwysiu in https://github.com/grafana/x-ray-datasource/pull/384
  • Bump jest from 29.7.0 to 30.0.0 by @dependabot[bot] in https://github.com/grafana/x-ray-datasource/pull/394
  • Add app signals services dashboard by @iwysiu in https://github.com/grafana/x-ray-datasource/pull/380
  • Bump prettier from 3.5.3 to 3.6.2 by @dependabot[bot] in https://github.com/grafana/x-ray-datasource/pull/396
  • Bump @types/node from 22.15.21 to 22.16.4 by @dependabot[bot] in https://github.com/grafana/x-ray-datasource/pull/400
  • Bump cspell from 9.0.2 to 9.1.5 by @dependabot[bot] in https://github.com/grafana/x-ray-datasource/pull/398
  • Bump lefthook from 1.11.13 to 1.12.2 by @dependabot[bot] in https://github.com/grafana/x-ray-datasource/pull/397
  • Bump @swc/core from 1.11.29 to 1.12.14 by @dependabot[bot] in https://github.com/grafana/x-ray-datasource/pull/399
  • Bump github.com/aws/aws-sdk-go-v2/service/applicationsignals from 1.11.1 to 1.11.3 by @dependabot[bot] in https://github.com/grafana/x-ray-datasource/pull/395
  • Bump golang.org/x/sync from 0.14.0 to 0.16.0 by @dependabot[bot] in https://github.com/grafana/x-ray-datasource/pull/393
  • Bump github.com/grafana/grafana-plugin-sdk-go from 0.277.1 to 0.278.0 by @dependabot[bot] in https://github.com/grafana/x-ray-datasource/pull/390
  • Bump github.com/aws/aws-sdk-go-v2/service/xray from 1.31.4 to 1.31.7 by @dependabot[bot] in https://github.com/grafana/x-ray-datasource/pull/392
  • Bump @stylistic/eslint-plugin-ts from 4.4.0 to 4.4.1 by @dependabot[bot] in https://github.com/grafana/x-ray-datasource/pull/401
  • Bump @eslint/js from 9.27.0 to 9.31.0 by @dependabot[bot] in https://github.com/grafana/x-ray-datasource/pull/403
  • Bump jest and @types/jest by @dependabot[bot] in https://github.com/grafana/x-ray-datasource/pull/402
  • Bump jest-environment-jsdom from 29.7.0 to 30.0.4 by @dependabot[bot] in https://github.com/grafana/x-ray-datasource/pull/405
  • Update docs for Application Signals services by @iwysiu in https://github.com/grafana/x-ray-datasource/pull/382
  • Remove @types/glob by @dependabot[bot] in https://github.com/grafana/x-ray-datasource/pull/404
  • Bump @grafana/plugin-ui from 0.10.6 to 0.10.7 by @dependabot[bot] in https://github.com/grafana/x-ray-datasource/pull/406
  • Bump @swc/jest from 0.2.38 to 0.2.39 by @dependabot[bot] in https://github.com/grafana/x-ray-datasource/pull/408
  • Bump @types/lodash from 4.17.17 to 4.17.20 by @dependabot[bot] in https://github.com/grafana/x-ray-datasource/pull/407
  • Bump @babel/core from 7.27.1 to 7.28.0 by @dependabot[bot] in https://github.com/grafana/x-ray-datasource/pull/409
  • Bump @swc/core from 1.12.14 to 1.13.0 by @dependabot[bot] in https://github.com/grafana/x-ray-datasource/pull/410
  • Bump github.com/grafana/grafana-aws-sdk from 0.38.4 to 1.0.5 by @dependabot[bot] in https://github.com/grafana/x-ray-datasource/pull/385
  • Cleanup the remaining X-rays by @iwysiu in https://github.com/grafana/x-ray-datasource/pull/411

2.15.0

  • Bump the all-go-dependencies group across 1 directory with 3 updates in #360
  • Bump the all-node-dependencies group across 1 directory with 18 updates in #359
  • App Signals: Implement List Service Level Objectives query in #361
  • App Signals: Implement ListServiceDependencies in #356
  • Update for grafana-aws-sdk new style v2 authentication in #336

2.14.0

  • Feat: Auto convert w3c trace format (#184) in #332
  • Actions: Do not use hashes for grafana/ actions in #352
  • Github actions: Add token permissions in #351
  • Implement listServiceOperations in #349
  • add zizmor ignore rule in #350
  • use vault token instead of github in #348
  • use vault for e2e secrets in #346
  • Update github actions files in #345
  • Create App Signals dropdown and ListServices query in #338
  • Update for aws-sdk-go-v2 in #305
  • Chore: add label to external contributions in #310
  • Bump the all-node-dependencies group across 1 directory with 42 updates in #343
  • Bump the all-go-dependencies group across 1 directory with 7 updates in #342
  • Bump golang.org/x/net from 0.34.0 to 0.36.0 in the go_modules group in #325
  • Bump dompurify from 3.2.3 to 3.2.4 in the npm_and_yarn group in #319

2.13.2

  • Update github.com/grafana/grafana-plugin-sdk-go to v0.265.0 in #313
  • Bump the all-go-dependencies group across 1 directory with 3 updates in #307
  • Chore: update e2e tests workflow in #303
  • Bump golang.org/x/crypto from 0.30.0 to 0.31.0 in the go_modules group in #288

2.13.1

  • Update readme to include info on Compatibility in #301

2.13.0

  • Add PDC support in #282
  • Replace @grafana/experimental with @grafana/plugin-ui in #292

2.12.0

  • Bump the all-node-dependencies group with 19 updates in #289
  • Bump the all-go-dependencies group across 1 directory with 4 updates in #283
  • Add start time to response in #286

2.11.0

  • Bump the all-node-dependencies group across 1 directory with 31 updates in #275
  • Bump nanoid from 3.3.7 to 3.3.8 in the npm_and_yarn group in #274
  • Bump the all-go-dependencies group across 1 directory with 4 updates in #269
  • Bump cross-spawn from 7.0.3 to 7.0.6 in the npm_and_yarn group in #271
  • Bump path-to-regexp from 1.8.0 to 1.9.0 in the npm_and_yarn group in #260
  • Bump the all-go-dependencies group across 1 directory with 3 updates in #262
  • Bump micromatch from 4.0.7 to 4.0.8 in the npm_and_yarn group in #259
  • Bump the all-github-action-dependencies group with 2 updates in #255
  • Bump webpack from 5.93.0 to 5.94.0 in the npm_and_yarn group in #258
  • Upgrade grafana-plugin-sdk-go (deps): Bump github.com/grafana/grafana-plugin-sdk-go from 0.252.0 to 0.255.0 in #252
  • Chore: bump dependencies in #251
  • Chore: Update plugin.json keywords in #250
  • Update plugin name to match Amazon convention in #247

2.10.1

  • chore: add errorsource in #245
  • Chore: Rename datasource file in #243
  • Add pre-commit hook with lint and spellcheck #242
  • Use yarn instead of cspell for precommit hook #246

2.10.0

  • Chore: update dependencies in #240

2.9.1

  • Migrate to new form styling in config and query editors by @idastambuk in #235

2.9.0

  • Fix: pass empty array to query all columns by @kevinwcyu in #228
  • add stalebot for issues by @katebrenner in #226
  • Update to use datasource.Manage and sessions.GetSessionWithAuthSettings by @iwysiu in #232
  • Fix: use ReadAuthSettings to get authSettings in #236

2.8.3

2.8.2

  • Update grafana/aws-sdk-go to 0.20.0 in https://github.com/grafana/x-ray-datasource/pull/220

2.8.1

  • Bump go.opentelemetry.io/contrib/instrumentation/net/http/httptrace/otelhttptrace from 0.37.0 to 0.44.0 by @dependabot in https://github.com/grafana/x-ray-datasource/pull/208
  • Bump google.golang.org/grpc from 1.58.2 to 1.58.3 by @dependabot in https://github.com/grafana/x-ray-datasource/pull/212
  • Bump go.opentelemetry.io/contrib/instrumentation/google.golang.org/grpc/otelgrpc from 0.45.0 to 0.46.0 by @dependabot in https://github.com/grafana/x-ray-datasource/pull/218
  • Upgrade underscore, d3-color, debug, cosmiconfig, yaml dependencies by @fridgepoet in https://github.com/grafana/x-ray-datasource/pull/217

Full Changelog: https://github.com/grafana/x-ray-datasource/compare/v2.8.0...v2.8.1

2.8.0

  • Migrate ConfigEditor and QueryEditor to the new form styling #211

  • Bump google.golang.org/grpc from 1.54.0 to 1.56.3 in #210

  • Support Node 18 in 201

2.7.2

  • Fix X-Ray Service Map filter trace list query by @jamesrwhite in https://github.com/grafana/x-ray-datasource/pull/203

2.7.1

  • Update @grafana/aws-sdk to fix a bug in temporary credentials

2.7.0

  • Update grafana-aws-sdk to v0.19.1 to add il-central-1 to the opt-in region list

2.6.2

  • Bump grafana/aws-sdk-react dependency #191
  • Remove code coverage workflow #188

2.6.1

  • Update grafana-aws-sdk version to include new region in opt-in region list https://github.com/grafana/grafana-aws-sdk/pull/80
  • Security: Upgrade Go in build process to 1.20.4
  • Update grafana-plugin-sdk-go version to 0.161.0 to avoid a potential http header problem. https://github.com/grafana/athena-datasource/issues/233

2.6.0

  • Update backend dependencies

2.5.0

  • Add SQL to trace by @kevinwcyu in https://github.com/grafana/x-ray-datasource/pull/173

2.4.0

  • Add spellcheck and fix misspellings by @sunker in https://github.com/grafana/x-ray-datasource/pull/158
  • Migrate to create-plugin by @iwysiu in https://github.com/grafana/x-ray-datasource/pull/148
  • Update code coverage workflow by @idastambuk in https://github.com/grafana/x-ray-datasource/pull/162
  • Update @grafana/aws-sdk by @kevinwcyu in https://github.com/grafana/x-ray-datasource/pull/164
  • Dependencies: Update @grafana dependencies to 9.3.2 by @idastambuk in https://github.com/grafana/x-ray-datasource/pull/167
  • Small Refactor: Do not fetch account id if not on service map page by @sarahzinger in https://github.com/grafana/x-ray-datasource/pull/169
  • Upgrade grafana-aws-sdk to v0.12.0 by @fridgepoet in https://github.com/grafana/x-ray-datasource/pull/171

Full Changelog: https://github.com/grafana/x-ray-datasource/compare/v2.2.0...v2.4.0****

2.3.0

  • Feature: Make it possible to filter on account id in https://github.com/grafana/x-ray-datasource/pull/157

2.2.0

  • Make properties of SummaryStatistics optional

2.1.2

  • Security: Upgrade Go in build process to 1.19.3

2.1.1

  • Security: Upgrade Go in build process to 1.19.2

2.1.0

  • Bump terser from 4.8.0 to 4.8.1 by @dependabot in https://github.com/grafana/x-ray-datasource/pull/130
  • Fix Trace List with variable by @iwysiu in https://github.com/grafana/x-ray-datasource/pull/132
  • Upgrade to grafana-aws-sdk v0.11.0 by @fridgepoet in https://github.com/grafana/x-ray-datasource/pull/139

Full Changelog: https://github.com/grafana/x-ray-datasource/compare/v2.0.1...v2.1.0

v.2.0.1

  • Bug fix for auth with keys: https://github.com/grafana/x-ray-datasource/pull/128
  • Code Coverage Changes
  • Code owners changes

v2.0.0

What's Changed

  • Stopping support for Grafana versions under 8.0.0 by @yaelleC in https://github.com/grafana/x-ray-datasource/pull/122

Bug fixes

  • Update minimum IAM policy by @iwysiu in https://github.com/grafana/x-ray-datasource/pull/115
  • Fix deprecated use of strings.Title by @fridgepoet in https://github.com/grafana/x-ray-datasource/pull/119

Other

  • Update grafana-aws-sdk by @andresmgot in https://github.com/grafana/x-ray-datasource/pull/121

v1.4.0

Bug fixes

  • Use non opt-in region when obtaining tokens for assumed roles
  • Fix wrong start and end times #89
  • Fix time durations after format change #88
  • Avoid error if the URL in tags cannot be parsed #84

Other

  • Modify the User-Agent for requests. Now it will follow this form: "aws-sdk-go/$aws-sdk-version ($go-version; $OS;) X-ray/$X-ray-version-$git-hash Grafana/$grafana-version"

v1.3.4

Bug fixes

  • Add readable names for stats in service map legend #82
  • Upgrade grafana-aws-sdk version fixing issue with assuming role #81

Other

  • Bump prismjs from 1.23.0 to 1.24.0 #80

v1.3.3

Other

  • Bump grafana/aws-sdk and Grafana dependency version #77

v1.3.2

Features / Enhancements

  • Use ConnectionConfig from grafana-aws-sdk #73
  • Bump prismjs from 1.21.0 to 1.23.0 #70

v1.3.1

Bug fixes

  • Remove usage of non backward compatible API preventing using the 1.3.0 version in Grafana before 7.4.0. #67

Other

  • Locks Grafana dependencies on latest stable release preventing compilation fails in CI. #68

v1.3.0

Features / Enhancements

  • Add Service Map query type that allows visualizing service map data in similar way to X-Ray console. #60

v1.2.0

Features / Enhancements

  • Updates the authentication settings in the plugin config page to include SDK default authentication mechanism and use our Grafana specific auth SDK for AWS. #59

v1.1.0

Features / Enhancements

  • Add regions selector to the query editor. #57

v1.0.1

  • Version bump needed for CI automated release

v1.0.0

  • Initial Release