Plugins 〉Grafana Profiles Drilldown


Grafana Profiles Drilldown
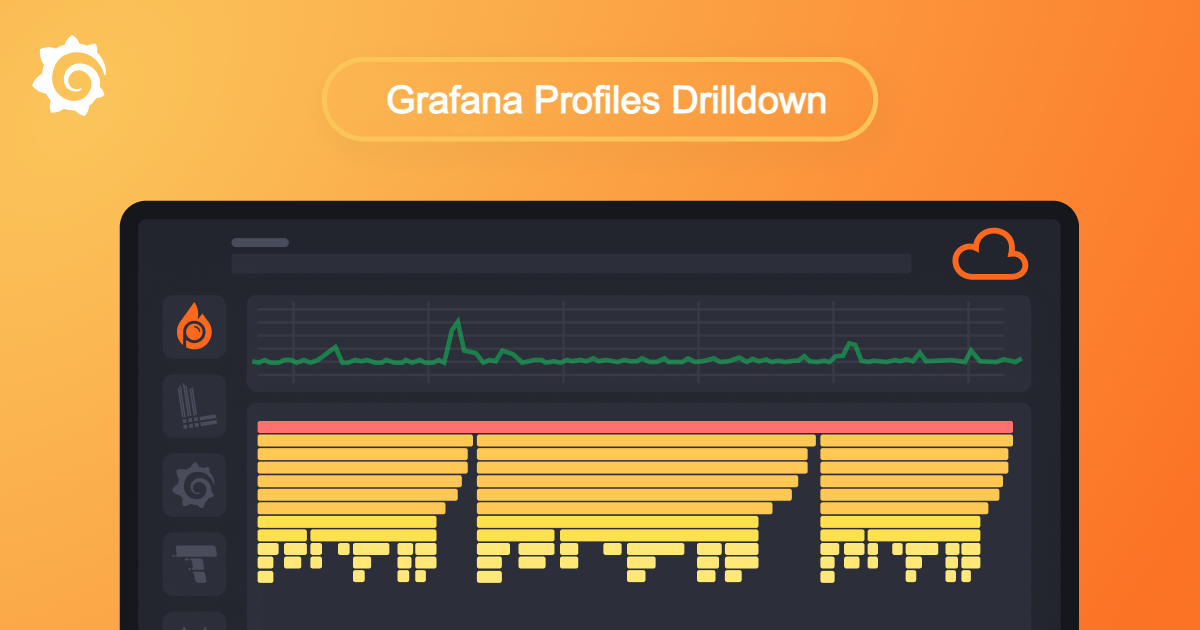
Grafana Profiles Drilldown
Grafana Profiles Drilldown is a native Grafana application designed to integrate seamlessly with Pyroscope, the open-source continuous profiling platform, providing a smooth, query-less experience for browsing and analyzing profiling data.
Key features include:
- Native integration with Pyroscope: Seamlessly integrates with Pyroscope backend to provide detailed performance profiling and analysis.
- Query-less browsing: Navigate profiling data without the need for complex queries.
- AI-Powered flame graph analysis: uses a large-language model (LLM) to assist with flame graph data interpretation so you can identify bottlenecks, and get to the bottom of performance issues faster.

Before you begin
To use Grafana Profiles Drilldown with Grafana Cloud, you need:
- A Grafana Cloud account
- A Grafana stack in Grafana Cloud with a configured Pyroscope data source receiving profiling data
To use Grafana Profiles Drilldown with self-hosted Grafana open source or Grafana Enterprise, you need:
- Your own Grafana instance running 11.0 or newer
- Pyroscope 1.7 or newer
- A configured Pyroscope data source receiving profiling data
Getting started
Refer to the Grafana Profiles Drilldown documentation. For instructions installing, refer to the access and installation instructions.
Resources
Contributing
We love accepting contributions! If your change is minor, please feel free submit a pull request If your change is larger, or adds a feature, please file an issue beforehand so that we can discuss the change. You're welcome to file an implementation pull request immediately as well, although we generally lean towards discussing the change and then reviewing the implementation separately.
For more information, refer to Contributing to Grafana Profiles Drilldown
Bugs
If your issue is a bug, please open one here.
Changes
We do not have a formal proposal process for changes or feature requests. If you have a change you would like to see in Grafana Profiles Drilldown, please file an issue with the necessary details.
Grafana Cloud Free
- Free tier: Limited to 3 users
- Paid plans: $55 / user / month above included usage
- Access to all Enterprise Plugins
- Fully managed service (not available to self-manage)
Self-hosted Grafana Enterprise
- Access to all Enterprise plugins
- All Grafana Enterprise features
- Self-manage on your own infrastructure
Install on Grafana Cloud
Plugins can be installed directly from within your Grafana instance or automated using the Cloud API or Terraform.
Learn more about plugin installationMarketplace plugins
This is a paid plugin developed by a marketplace partner. To purchase an entitlement, sign in first, then fill out the contact form.
Get this plugin
This is a paid for plugin developed by a marketplace partner. To purchase entitlement please fill out the contact us form.
What to expect:
- Grafana Labs will reach out to discuss your needs
- Payment will be taken by Grafana Labs
- Once purchased the plugin will be available for you to install (cloud) or a signed version will be provided (on-premise)
Thank you! We will be in touch.
For more information, visit the docs on plugin installation.
Installing on a local Grafana:
For local instances, plugins are installed and updated via a simple CLI command. Plugins are not updated automatically, however you will be notified when updates are available right within your Grafana.
1. Install the Application
Use the grafana-cli tool to install Grafana Profiles Drilldown from the commandline:
grafana-cli plugins install The plugin will be installed into your grafana plugins directory; the default is /var/lib/grafana/plugins. More information on the cli tool.
Alternatively, you can manually download the .zip file for your architecture below and unpack it into your grafana plugins directory.
Alternatively, you can manually download the .zip file and unpack it into your grafana plugins directory.
2. Enable it
Next, log into your Grafana instance. Navigate to the Plugins section, found in your Grafana main menu.
Click the Apps tabs in the Plugins section and select the newly installed app.
To enable the app, click the Config tab. Follow the instructions provided with the application and click Enable. The app and any new UI pages are now accessible from within the main menu, as designed by the app creator.
If dashboards have been included with the application, they will attempt to be automatically installed. To view the dashboards, re-import or delete individual dashboards, click the Dashboards tab within the app page.
Changelog
2.1.0 (2026-07-02)
🎉 Features
🐛 Bug Fixes
- deps: bump dompurify override to ~3.4.11 for CVE remediation (#1027) (52ca002)
- deps: update dependency protobufjs to v8.2.0 [security] (#1001) (e4ed126)
- security/unknown/samples/rideshare: update module golang.org/x/sys to v0.44.0 [security] (#1000) (47d37b1)
🤖 Continuous Integrations
🧹 Chore
- Add myself as a CODEOWNER (#1015) (8f7b5e6)
- Better feature tracking for uploading profiles (#983) (d6b2dda)
- ci/cd: update to 10.1.0 (#1030) (b1a5d19)
- ci: Update release workflows (#1036) (e858b91)
- deps: bump @openfeature/ofrep-web-provider from 0.3.6 to 0.4.1 (#1011) (f486480)
- deps: update golang:1.26.3 docker digest to 2d6c802 (#996) (4f07155)
- Regenerate pyroscope API client (#1025) (c71c1e9)
- Remove publish-technical-documentation workflows (#1026) (227ab2b)
- Sanitize AiReply button link (#1010) (500489b)
- Surface backend error of creating a recording rule (#1014) (bb36a4c)
- Update LLM package (#1032) (667e618)
- Update packages (#1020) (f025c68)
- Workflows update (#995) (f665d6d)
2.0.7
Chores
- Update ci-cd-workflows (#987) (3de7b007)
- update Saved queries texts (#1006) (500d8d73)
- Harden package use and workspace environment (#984) (1ace8a94)
- Fix translations (#986) (b58dea2d)
- Use tabs instead of custom menu navigation (#974) (59c90d52)
New Features
- Support add to dashboard (#970) (667d2a21)
Bug Fixes
- update Crowdin workflows for get-vault-secrets breaking change (#1008) (86eabe59)
- Recording Rules: Stop dropping profile type, service name, and function name on submit (#979) (c1d75858)
Other Changes
- Download translations from Crowdin (#993) (5e02932b)
- Download translations from Crowdin (#953) (ff04cc53)
2.0.6
Chores
- deps:
- bump protobufjs from 8.0.1 to 8.0.3 (#976) (9fdea055)
- update dependency protobufjs@^7.3.0 to v8 [security] (#972) (f4a4eea9)
- lock file maintenance (#969) (6b3f68a2)
- bump hono from 4.12.16 to 4.12.18 (#966) (b6edc18f)
- bump fast-uri from 3.1.1 to 3.1.2 (#967) (107f6c96)
- pin dependencies (#958) (8ac3c790)
- lock file maintenance (#926) (8ff0c056)
- update alpine:latest docker digest to 5b10f43 (#959) (4115a9ef)
- update golang:1.26 docker digest to b54cbf5 (#960) (7fcafe6c)
- Update rideshare mod (#971) (f92c3079)
- Update which feature flags are on by default (#965) (fd0ee099)
- Fix loading translations before i18n available (#963) (87519cbf)
- fix tests (#962) (1dc0d256)
New Features
- time picker: add support for keyboard shortcuts (#936) (2965dbb3)
Bug Fixes
- Download json (#975) (e7fdec78)
Other Changes
- occured -> occurred in AI panel error message (#968) (dcb321f9)
2.0.5
Build System / Dependencies
- migrate to pnpm (#949) (c26b6a84)
Chores
- Update @grafana/flamegraph to 13.1.0-25141410377 (#957) (0464d5bf)
- Use OpenFeature for all feature flags (#950) (75caf58d)
- deps: bump postcss from 8.4.39 to 8.5.12 (#954) (bbe86aaf)
- i18n: Expose all supported languages in plugin.json (#904) (37bdb2b6)
New Features
- Use Grafana Assistant for Optimize Code button when available (#943) (284dc66f)
Bug Fixes
- Revert changes to analyze flame graph button in SceneFlameGraph (#955) (c3d03d93)
- consolidate CI/CD into single workflow to fix broken
workflow_runchaining (#956) (218f43eb)
Other Changes
- Download translations from Crowdin (#951) (4ff76d61)
Performance Improvements
- i18n: prevent loading en-US translations at runtime (#938) (be0806e6)
2.0.4
Chores
- deps:
- update dependency dompurify to v3.4.0 [security] (#942) (0487f527)
- update dependency hono to v4.12.14 [security] (#941) (2c403fcf)
New Features
- adhoc: add diff view with side-by-side and computed diff modes (#842) (d4461470)
Bug Fixes
- deps:
- patch CVEs via yarn resolutions (#948) (5624f69b)
- update dependency protobufjs to v8 [security] (#946) (04b77a2f)
- update module go.opentelemetry.io/otel/sdk to v1.43.0 [security] (#933) (63e52289)
- samples: upgrade otel/sdk to v1.43.0 to address CVE (#940) (fbf87a0c)
2.0.3
Chores
- ci: fix flaky tests (#939) (afd7acbe)
2.0.2
Chores
- fix docker compose setup (#928) (30ba539f)
- Warning for missing service names (#924) (0815b4ac)
- Add more Renovate groups (#919) (b54139d1)
- deps:
- update dependency @hono/node-server to v1.19.13 [security] (#930) (693a90c3)
- update dependency hono to v4.12.12 [security] (#931) (ad2d87fc)
- update dependency lodash to v4.18.1 [security] (#921) (23fbc2b6)
- update dependency lodash to v4.18.1 [security] (#920) (5f0445c5)
- update dependency @types/node to v22.19.15 (#917) (d51853aa)
- update dependency @babel/core to v7.29.0 (#915) (e82681ea)
- update dependency tar to v7.5.13 (#913) (30192d02)
- update dependency semver to v7.7.4 (#912) (19d23060)
- update dependency nanoid to v5.1.7 (#911) (e349f466)
- update dependency i18next-cli to v1.51.4 (#910) (a2ed6c79)
- update dependency eslint-plugin-jsdoc to v62.8.1 (#907) (b99184b1)
- update dependency hono to v4.12.9 (#909) (5d3aa217)
- update dependency hono to v4.12.9 (#908) (3f0a50fe)
- update dependency eslint-plugin-jest to v29.15.1 (#906) (2348000f)
- update qdrant/qdrant docker digest to 9472857 (#896) (3fc040e6)
- update dependency esbuild to v0.27.4 (#905) (3999a247)
- update dependency @hono/node-server to v1.19.11 (#897) (6370f737)
- update dependency @types/lodash to v4.17.24 (#902) (87f9cca9)
- update dependency dompurify to v3.3.3 (#903) (0e90e176)
- update dependency @react-aria/utils to v3.33.1 (#900) (191768c9)
- update dependency @types/color to v3.0.7 (#901) (ed7b3a03)
- update grafana/grafana-enterprise:latest docker digest to 8b65309 (#895) (d04d330c)
- bump undici from 7.18.2 to 7.24.6 (#892) (162bfc66)
- update actions/checkout digest to 34e1148 (#847) (4bf70e2f)
- bump brace-expansion from 1.1.12 to 1.1.13 (#887) (c39dd9d7)
- update dependency serialize-javascript to v7.0.5 [security] (#888) (513129b6)
- pin dependencies (#846) (a851ae51)
- bump picomatch from 2.3.1 to 2.3.2 (#881) (a913aae0)
- update alpine:latest docker digest to 2510918 (#848) (f71200bb)
- config: migrate config renovate.json (#922) (2f3a4847)
- i18n:
- add Crowdin GitHub Actions (#889) (694b0dd1)
- add ESLint rules and translate all user-facing strings (#885) (95a9b848)
- add @grafana/i18n infrastructure (#865) (b1a208a9)
- eslint: migrate to ESLint 9 flat config (#876) (e7d6f2c7)
Documentation Changes
- add exemplars documentation (#890) (591fe58b)
- Increase weight of Profiles Drilldown to 200 (#923) (1f4fb7fc)
New Features
- labels: support UTF-8 label names in label matchers (#925) (2521cffa)
- ResolutionBoostExtensionPoint: pass datasourceUID to Adaptive Profiles extension (#880) (7a1b2f6f)
- call-tree: enable the call tree visualization (#862) (7cfcb89c)
Bug Fixes
- Sync time range sync between Diff page and the other pages (#784) (fce256a5)
- deps: update grafana packages (#914) (53f1c84f)
- ci: add permissions to PR validation workflow for Dependabot PRs (#883) (db27bf06)
Other Changes
- Download translations from Crowdin (#918) (9578b975)
- Download translations from Crowdin (#893) (5d3e1434)
2.0.1
Chores
- Remove unused / update dependencies (#879) (0c0eb57a)
- deps:
- bump undici from 7.18.2 to 7.24.5 (#878) (91da6ba2)
- bump minimatch from 3.1.2 to 3.1.5 (#877) (03e3b581)
- update grafana/grafana-enterprise:latest docker digest to 8e8fc4c (#849) (fda61e94)
- update dependency flatted to v3.4.2 [security] (#874) (3ad985dc)
2.0.0
Chores
- deps:
- pin 11 transitive dependencies to fix 15 CVEs (#873) (a58f1e9b)
- pin minimatch@9.0.3 to 9.0.9 to fix CVE (#871) (4d79df99)
- bump undici from 7.18.2 to 7.24.4 (#867) (a7e5cfe1)
- update dependency tar to v7.5.11 [security] (#854) (b2a3b84c)
- bump hono from 4.11.9 to 4.12.0 (#834) (e3e92a16)
- bump ajv from 6.12.6 to 6.14.0 (#835) (6f272630)
- React 19 upgrade (#858) (606a7c0a)
- Fix codeowners file (#863) (d4d4e5a5)
- add other drilldown teams as codeowners (#841) (8985e093)
- cd: remove github-draft-release (#850) (00bbdcc8)
Documentation Changes
- Updates for the latest release (#869) (8b135fc6)
New Features
- Support Saved Queries (#868) (bb418724)
- Add AGENTS.md and surrounding files (#870) (dffe1202)
- highlight filtered exemplar on the timeseries for the flame gra… (#802) (7ce57937)
- inspect a single exemplar's flamegraph (#796) (01dfcb1e)
Refactors
- remove unused exemplar link helpers from data-transformations (#859) (9b44b15f)
- rename exemplars var (#857) (23466603)
1.17.0
Chores
- release:
- publish github release (#825) (0c0d43ee)
- publish the release to github (6554320b)
- deps:
- update dependency tar to v7.5.8 [security] (#829) (e549788b)
- bump esbuild to 0.25.0 (#827) (ec99bdeb)
- update dependency @bufbuild/protoc-gen-es to v2.11.0 (#810) (55e4a194)
- update dependency terser-webpack-plugin to v5.3.16 (#807) (80596259)
- update dependency @types/lodash to v4.17.23 (#806) (46bf6def)
- update dependency webpack to v5.104.1 [security] (#813) (f3bab720)
- Upgrade packages (#814) (9879f7b4)
Bug Fixes
- deps: update grafana packages (#808) (807f4d8a)
- use selected profile's version in function details panel (#801) (5b2a85ea)
Other Changes
- release: publish the release to github" (00c520df)
1.16.0
New Features
- switch cloud-home-app plugin proxy usage to own (#579) (689f4c82)
1.15.2
Chores
- deps:
- Upgrade dependencies (#804) (418c922d)
- Upgrade playwright to 1.58.0 (#805) (4a322241)
1.15.1
1.15.0
Chores
- deps:
- bump js-yaml from 3.14.1 to 3.14.2 (#783) (27db8c2c)
- bump form-data from 4.0.0 to 4.0.5 (#781) (d7a8550e)
- bump brace-expansion from 1.1.11 to 1.1.12 (#782) (3bb1e0fb)
- Update react-router-dom to 6.30.3 (#798) (648f0af6)
- bump @modelcontextprotocol/sdk from 1.24.3 to 1.25.2 (#789) (76fe5444)
- bump undici from 7.16.0 to 7.18.2 (#794) (b24186dc)
- bump body-parser from 2.2.0 to 2.2.2 (#788) (5d90c82f)
- bump qs from 6.14.0 to 6.14.1 (#786) (8a9e6002)
- Remove investigations (#787) (188f8623)
Continuous Integration
- update workflows (#792) (98baf273)
New Features
- plot exemplars candidates in timeseries panel at the Flame graph view (#748) (9c87a512)
Bug Fixes
- assistant: pass origin to openAssistant (#797) (d3a13ab7)
- Handle missing location lines from profiles (#785) (9c7616c2)
1.14.2
Chores
- update llm plugin (#780) (9e097bd5)
1.14.1
Bug Fixes
- call /render for dot profiles only once Assistant is being opened (#778) (cbb2d764)
- DiffFlameGraph: prevent API queries with zero time ranges (#777) (665d9f9b)
1.14.0
Chores
- fix styling (#771) (14655e41)
New Features
- DiffFlameGraph: Analyze Diff Flame Graph with Grafana Assistant (#752) (e18b2639)
1.13.0
Chores
- deps:
- update dependency @connectrpc/protoc-gen-connect-query to v2.2.0 (#764) (6241abc8)
- update dependency @babel/core to v7.28.5 (#762) (eead60db)
- update dependency @stylistic/eslint-plugin-ts to v2.13.0 (#765) (0c8acd3d)
- update dependency @bufbuild/protoc-gen-es to v2.10.1 (#763) (a3326219)
- update dependency dotenv to v16.6.1 (#766) (11df5159)
- update dependency glob to v10.5.0 [security] (#751) (5cc428be)
- Upgrade Playwright to 1.57.0 (#760) (c094d592)
- Update Grafana version used locally to match CI (#753) (8acf4daf)
- remove unused deps (#742) (4066bdbc)
- Add renovate rules (#746) (a06fa858)
- update scenes (#733) (7d338e75)
- config: migrate config renovate.json (#749) (608da61c)
New Features
- Support source code integration for languages without file paths (#747) (a81f7109)
- Embed Profiles Drilldown (#621) (b510bd19)
Bug Fixes
- Do not force refresh ServiceName and ProfileMetric variables on time range change (#759) (4450a9ec)
1.12.0
Chores
- deps:
- update dependency @types/prismjs to v1.26.5 (#741) (fb16ca90)
- bump assistant-sdk version to 0.1.4 (6ecd1896)
- pin dependencies (#627) (74144bf5)
- fix shared workflows versions (#736) (72747451)
- Remove unused CI workflows (#634) (838fe138)
- ci: Push PR branches to ops catalog (#735) (abd1e90f)
New Features
- adaptive profiles boost button extension point (#626) (04964dc7)
- Recording Rules: Show recording rule labels (#636) (e173a5d6)
Other Changes
- local (#744) (313db674)
1.11.0
Chores
- fix version bump (#635) (844dfea2)
- Update flamegraph package (#620) (6f31ac78)
- Fix plugin.json formatting (#612) (f1f22f27)
- Auto deploy to dev/ops (#618) (0b13153e)
- annotations: Show annotations only on main timeline panels (#624) (c14295b4)
- Recording Rules: Add disclaimer to metrics from profiles (#611) (4b306a5f)
Continuous Integration
- Use version 2.x.x of plugin workflows (#622) (70ce3fa9)
New Features
- Recording Rules: Allow using service_name as group by label (#617) (2825ee75)
Bug Fixes
- Recording Rules: Do not pass empty matchers (#616) (602530fe)
- GitHub: Keep GitHub Integration cookie between tabs (#609) (bb8ee3dd)
1.10.1
Chores
- Update flamegraph package (#607) (12c37c7e)
1.10.0
Chores
- Add missing target to plugin.json (#605) (3d7c76dc)
- Update @grafana/faro-web-sdk to latest release (#603) (cb3615dc)
- e2e: Upgrade Playwright to 1.55.1 (#604) (95940103)
Continuous Integration
- Deploy automatically to ops (#600) (9632905b)
New Features
- update extension point for grafana assistant, add vars and tests (#593) (50820a7a)
Bug Fixes
- Update grafana/assistant (#597) (6a5758ac)
1.9.0
Chores
- Use a specific version of Pyroscope for e2e tests (#587) (ab5a4543)
Continuous Integration
- Add a workflow to publish a PR/branch (#578) (c690fc67)
New Features
- Metrics From Profiles: Automatically prefix metric name (#592) (7404aba4)
- Add rate calculation support and step synchronization (#548) (0538e0bc)
- AI: Integrate with Grafana Assistant (#558) (0756b05a)
Bug Fixes
- recording rules list to use rule id as row id (#591) (d07f2528)
- use rule id as row id (4e261a87)
1.8.1
1.8.0
Chores
- Upgrade playwright to 1.55 (#576) (601ee656)
- Create plugin update (#564) (2ef28dc6)
Continuous Integration
- Use shared action to create a changelog (32e56544)
- Update release workflow (#573) (939c7b68)
- Push build to ops (#570) (f42be894)
- Use shared workflows for publishing (#565) (96855248)
1.7.0 (2025-07-31)
Features
- Propagate the redirect_uri for GitHub logins (#541) (d0ae06c)
- Recording Rules: Pass function name to recording rules (#543) (9000fd4)
- Support for provisioned recording rules (#549) (dc5fea3)
1.6.0 (2025-07-29)
Features
1.5.0 (2025-07-10)
Features
- GitHub Integration: Keep GitHub auth cookie within the same session if the data source doesn't change (#535) (8a7b157)
- Metrics from Profiles: Allow creating recording rules for all services (#525) (837393b)
- metrics: Show annotations (#522) (5259b0b)
1.4.1 (2025-05-21)
Features
1.4.0 (2025-05-15)
Features
1.3.0 (2025-04-16)
Bug Fixes
- Cascader options break when services have multiple levels with matching prefix (#484) (2bb6034)
- Settings: Reload settings when data source changes (#474) (23d814b)
Features
- CI: Append SHA to version number when releasing from main (#455) (03e6158)
- Metrics: Basic UI for experimental metrics from profiles (#462) (1500a59)
1.2.3 (2025-04-03)
Bug Fixes
1.2.2 (2025-04-03)
Bug Fixes
1.2.1 (2025-04-02)
Bug Fixes
- FlameGraph: Use entire file as context in "Optimize Code" prompt (#459) (569c17c)
- llm: Add extra context in AI prompt about other lines in a file (#460) (004b7aa)
Features
1.2.0 (2025-03-10)
Features
- Add generated typed Pyroscope API client (#410) (2e2b4e1)
- FlameGraph: Show the flame graph for a selected span (#445) (2e036ee)
1.1.0 (2025-02-21)
Bug Fixes
Features
- investigations: adapt to changed plugin id (#429) (7b41af9)
- Rename Explore Profiles to Grafana Profiles Drilldown (#430) (e91ff90), closes #432
1.0.0 (2025-02-14)
Features
0.1.23 (2025-02-14)
Bug Fixes
0.1.22 (2025-02-13)
Bug Fixes
Features
0.1.21 (2025-02-12)
Bug Fixes
0.1.20 (2025-02-06)
Bug Fixes
- Filters: Ensure filters are always cleared when changing the data source or the service (#374) (1c7b6c3)
- FunctionDetailsPanel: Fix start ellipsis for file names containing non-alpha chars (#373) (f79a1b7)
- GitHubIntegration: Handle function details for inlining (#347) (5e28b3c)
- Grid: Fix error message display (#359) (1ca4ff2)
- Settings: Prevent warning to be displayed when no settings is returned by the Settings API (#384) (cdce58a)
Features
- AdHocView: Remove Grafana menu item to the Ad Hoc view (#385) (5c265fb)
- LabelsView: Add maxima visualizations (#361) (25095c6)
- LabelsView: update main time series when a "group by" label is selected (#341) (775b37d)
Performance Improvements
0.1.19 (2025-01-27)
Bug Fixes
0.1.18 (2025-01-23)
Bug Fixes
- DiffFlameGraphView: Clear preset option when applying auto-select (#313) (b0f4001)
- DiffFlameGraphView: Preserve context after leaving/re-entering the view (#319) (367ddab)
- Header: Prevent crash if useChromeHeaderHeight is not available (for Grafana < 11.3) (#312) (c638416)
- QueryRunners: Prevent invalid queries to run (#316) (5f5046c)
Features
- Add investigations support (#301) (7f95852)
- Add query link extension (#220) (62720ad)
- DiffView: Time ranges sync (#288) (45cea14)
- FlameGraph: Keep items focused when data changes (#336) (d8ff887)
- GitHubIntegration: Add info tooltip on connect button (#328) (a929ddd)
- Timeseries: Add open in Explore menu item (#300) (a9b0891)
- Upgrade Grafana to v11.3.0 (#287) (595a1cc)
Performance Improvements
Reverts
0.1.17 (2024-11-19)
Bug Fixes
- ServiceDropdown: Retrieve last used service name only if it's not provided in the URL (#284) (28ca16e)
0.1.16 (2024-11-14)
Bug Fixes
- QueryBuilder: Prevent invalid filters to be used after parsing (#276) (e6cac6e)
- Tracking: Ensure select action type is tracked (#278) (9527644)
- Tracking: Use custom reporter (#277) (dfbb3a6)
Features
- Export: Clarify that export to flamegraph.com option will create a public URL (#275) (c5a0962)
- Export: Disable export to flame graph.com (#280) (e631055)
0.1.15 (2024-11-05)
Bug Fixes
- DiffView: Clicking on "Auto-select" selects a 25% range (#254) (9b3dd8a)
- DiffView: Disable AI button when no selections (#258) (58e89cb)
- DiffView: Ensure ranges are initialized when landing (#233) (4f95549)
- DiffView: Fix headers wrap (#259) (6ada58a)
- DiffView: Fix incorrect preset label (#257) (a738694)
- ExplorationSelector: Fix background color (#255) (46db256)
- FunctionDetails: Correctly render blank lines (ec3ed5c)
- GitHubIntegration: Fix "Learn more" href (#245) (1848159)
- LabelValuesGrid: decrease column size to accommodate small screen resolutions (#235) (f62b17a)
- OnboardingModal: Change Grafana Agent to Grafana Alloy (#256) (27453ed)
- SettingsView: Fix back button after modifying the max nodes setting (#234) (673b44c)
- ShareableUrl: Fix when the default time range is selected (#244) (ae6ddeb)
- Small UI fixes (#248) (ee881fa)
- Timeseries: Persist scale when data changes (#251) (8cb6ced)
Features
- AppHeader: Revamp header (#230) (f482d7b)
- DiffFlameGraph: Add "how to" infos (#228) (494b659)
- DiffView: Add CTAs and comparison presets (#231) (e8bbf2e)
- LabelsView: Include/exclude panel actions (#210) (2c2d5f5)
- TimeSeries: Add menu with scale options (#249) (06b71d1)
0.1.14 (2024-10-17)
Bug Fixes
- Faro: Filter out events not related to the app (#225) (57a7c58)
- Header: Fix sticky header position in Grafana v11.3+ (#218) (a4f226f)
Features
0.1.13 (2024-10-08)
Features
0.1.12 (2024-10-04)
Bug Fixes
- Code: do not show Optimize Code button when no code is available (#208) (6af234d)
- Filters: ensure "is empty" filter is synced with URL (#205) (8fc8fc4)
- QueryBuilder: Filters with regex values can be edited in place (#207) (75de5e2)
Features
- Minor improvements (#211) (0486f33)
- QueryBuilder: Enable "in"/"not in" operators (#122) (9574828)
- StatsPanel: Add title on hover value + vertical border to separate compare actions (#212) (71a29e5)
0.1.11 (2024-09-30)
Features
- Minor UI improvements (timeseries point size, plugin info tooltip) (#194) (621982a)
- QuickFilter: Add results count (#193) (dc4012d)
0.1.10 (2024-09-25)
0.1.9 (2024-09-17)
Bug Fixes
- DiffFlameGraph: Remove non-working pprof export (#169) (662cd48)
- ExplainFlameGraph: Add tooltip when the LLM plugin is not installed (#163) (d395391)
- Faro: Fix Faro SDK config (#174) (3ed6362)
- Fix useUrlSearchParams (#171) (179b060)
- LabelsDataSource: Limit the maximum number of concurrent requests to fetch label values (#165) (cb8149c)
Features
- Add give feeback button and preview badge (#167) (a23fa61)
- AppHeader: Add Settings button (#172) (9d7fb6b)
- Remove legacy comparison views code (#143) (816363f)
- Upgrade Grafana to v11.2.0 (#173) (15680e6)
0.1.8 (2024-09-11)
Bug Fixes
Features
- Add histogram visualizations (#141) (2265be7)
- create new browser history entry on some user actions (#128) (5439ab3)
- DiffFlameGraph: Add flame graph range in timeseries legend (#140) (8729c31)
- GitHubIntegration: Migrate GitHub integration to Scenes (#142) (0386bbc)
- support submodules for GitHub Integration (#147) (52ecea8)
0.1.7 (2024-08-29)
Features
- Add histogram visualizations (#141) (2265be7)
- create new browser history entry on some user actions (#128) (5439ab3)
- DiffFlameGraph: Add flame graph range in timeseries legend (#140) (8729c31)
- GitHubIntegration: Migrate GitHub integration to Scenes (#142) (0386bbc)
0.1.6 (2024-08-27)
Bug Fixes
- Ci: Fix docker compose commands (#111) (4ee541a)
- DiffFlameGraph: Fix the "Explain Flame Graph" (AI) feature (#129) (a40c02b)
- Favorites: Render "No results" when there are no favorites (#101) (426469d)
- Labels: Fix "Discarded by user" error in the UI (#110) (2e9baab)
- SceneLabelValuePanel: Fix border color when baseline/comparison is selected (#123) (5b4058a)
- ScenesProfileExplorer: Make labels more responsive on smaller screens (10c97dc)
Features
- CompareView: Implement new Comparison view with Scenes (#119) (127d6c3)
- FlameGraph: Add missing export menu (#132) (f57b0ca)
- Labels: Improve comparison flow (#117) (31d0632)
- Timeseries: Add total resource consumption in legend (#108) (1fbb2df)
0.1.5 (2024-07-29)
Features
0.1.4 (2024-07-25)
Bug Fixes
- Onboarding: Handle gracefully when there's no data source configured (#76) (4c18444)
- PanelTitle: Remove series count when only 1 serie (#78) (8422e6d)
- SceneByVariableRepeaterGrid: Prevent extra renders (#86) (bf14755)
Features
- Avoid no data panels (#80) (72120b7)
- LabelsExploration: Introduce bar gauge visualisations (#72) (7b1b19a)
- SceneLabelValuesTimeseries: Colors and legends are preserved on expanded timeseries (#85) (6980299)
- Various enhancements after first UX interview (#81) (2cdfcbe)
0.1.3 (2024-07-19)
Bug Fixes
- Header: Switch the exploration type radio button group to a select on narrow screens (#70) (55f420a)
0.1.2 (2024-07-17)
Bug Fixes
- CompareAction: Add missing data source query parameter to compare URL (#58) (b1213e1)
- FunctionDetails: Get timeline state from Flame Graph component (#25) (64ed0e6)
- GitHub Integration: Correctly extract the start/end timestamps from time picker (#15) (fe8d807)
- SceneAllLabelValuesTableState: Fix color contrast in light mode (#26) (1bd268f)
- SceneByVariableRepeaterGrid: Set timeseries min to 0 (#31) (0e3a17d)
- SceneFlameGraph: Fix runtime error (#45) (6227f2d)
- SceneFlameGraph: Respect maxNodes when set in the URL (#29) (85dd5b7)
Features
- Analytics: Track Explore Profiles actions (#64) (ec58f57)
- DataSource: Store selected data source in local storage (#60) (9f7ede1)
- SingleView: Remove page (#20) (16da70d)
- Update plugin metadata to auto enable (#65) (3afd1cd)
- Various minor improvements (#46) (877b009)
0.1.0 (2024-07-15)
Explore Profiles is now available in its initial public release. It is designed to offer a seamless, query-less experience for browsing and analyzing profiling data.
Key features include:
- Native integration with Pyroscope: Seamlessly integrates with Pyroscope backend to provide detailed performance profiling and analysis.
- Query-Less Browsing: Navigate profiling data without the need for complex queries.
- AI-Powered flame graph analysis: uses a large-language model (LLM) to assist with flame graph data interpretation so you can identify bottlenecks, and get to the bottom of performance issues faster.
Bug Fixes
- GitHub Integration: Correctly extract the start/end timestamps from time picker (#15) (fe8d807)
- SceneAllLabelValuesTableState: Fix color contrast in light mode (#26) (1bd268f)
- SceneByVariableRepeaterGrid: Set timeseries min to 0 (#31) (0e3a17d)
- SceneFlameGraph: Fix runtime error (#45) (6227f2d)
- SceneFlameGraph: Respect maxNodes when set in the URL (#29) (85dd5b7)