Plugins 〉Grafana Metrics Drilldown


Grafana Metrics Drilldown
Grafana Metrics Drilldown
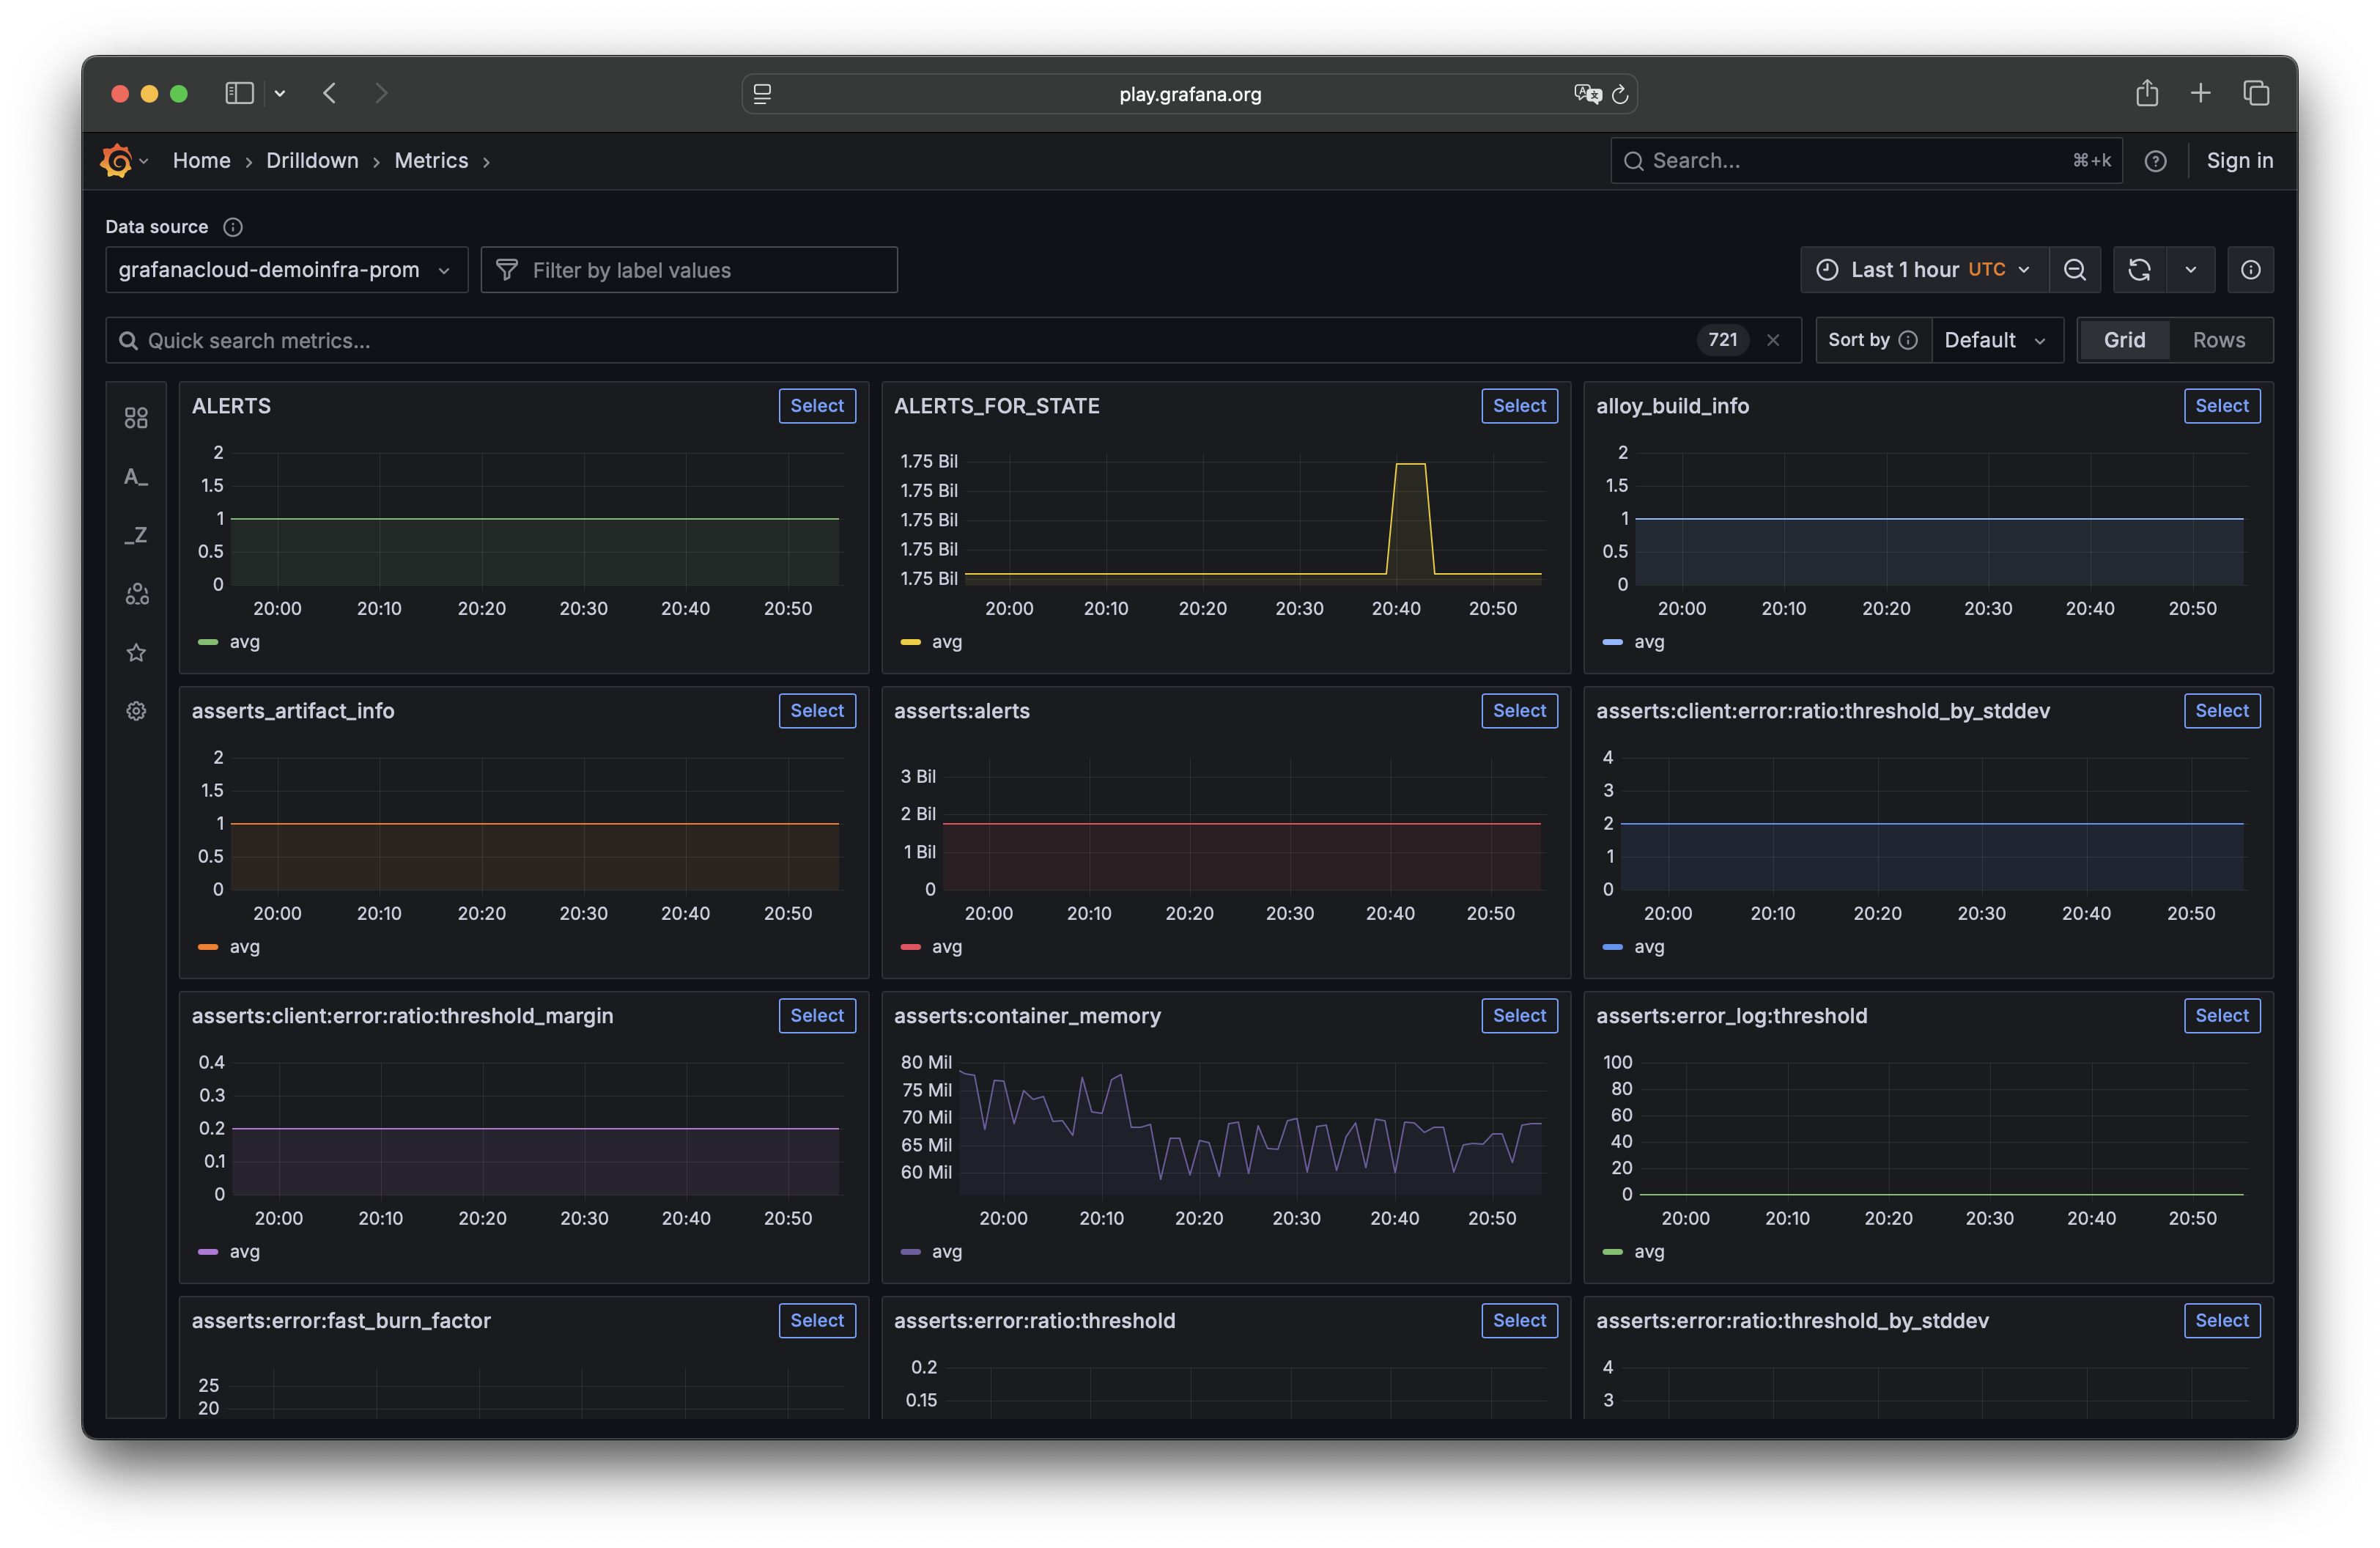
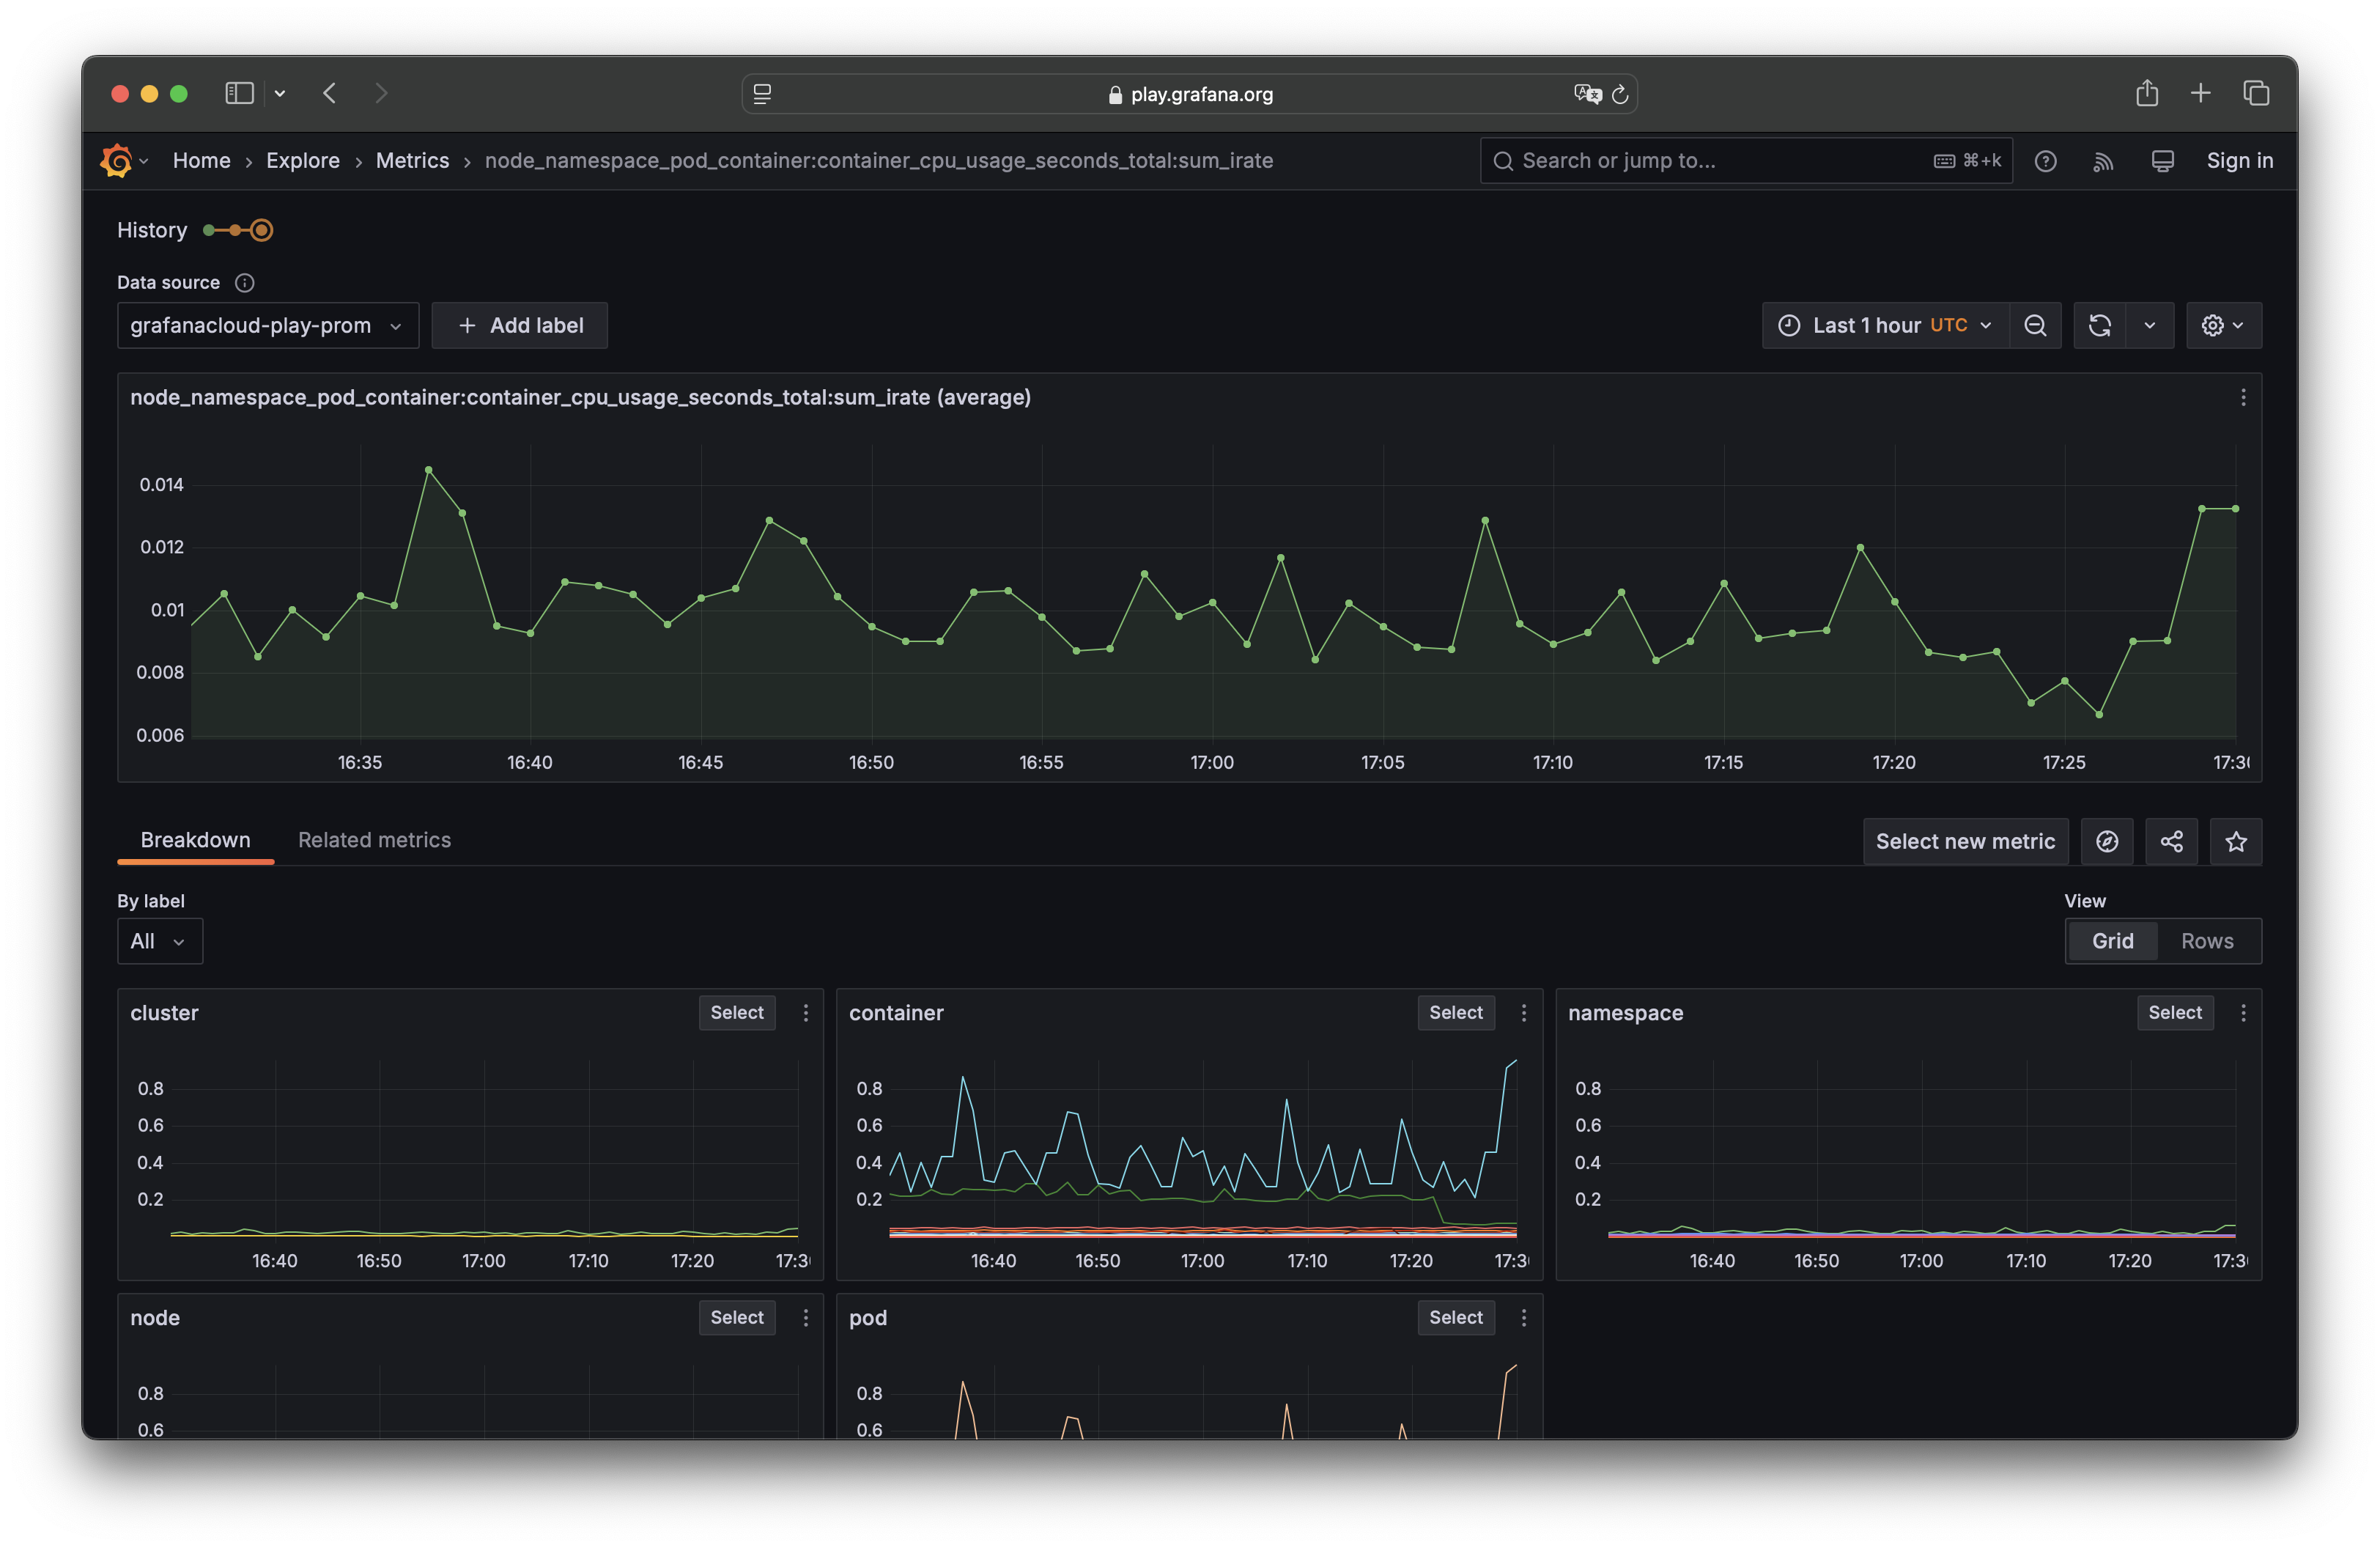
The Grafana Metrics Drilldown app provides a queryless experience for browsing Prometheus-compatible metrics. Quickly find related metrics without writing PromQL queries.
Requirements
Requires Grafana 11.6.0 or newer.
Getting Started
See the docs for more info using Grafana Metrics Drilldown.
Documentation
Contributing
We love accepting contributions! If your change is minor, please feel free submit a pull request. If your change is larger, or adds a feature, please file an issue beforehand so that we can discuss the change. You're welcome to file an implementation pull request immediately as well, although we generally lean towards discussing the change and then reviewing the implementation separately.
Bugs
If your issue is a bug, please open one here.
Changes
We do not have a formal proposal process for changes or feature requests. If you have a change you would like to see in Grafana Metrics Drilldown, please file an issue with the necessary details.
Grafana Cloud Free
- Free tier: Limited to 3 users
- Paid plans: $55 / user / month above included usage
- Access to all Enterprise Plugins
- Fully managed service (not available to self-manage)
Self-hosted Grafana Enterprise
- Access to all Enterprise plugins
- All Grafana Enterprise features
- Self-manage on your own infrastructure
Installing Grafana Metrics Drilldown on Grafana Cloud:
Installing plugins on a Grafana Cloud instance is a one-click install; same with updates. Cool, right?
Note that it could take up to 1 minute to see the plugin show up in your Grafana.
Warning
Plugin installation from this page will be removed in February 2026. Use the Plugin Catalog in your Grafana instance instead. Refer to Install a plugin in the Grafana documentation for more information.
Installing plugins on a Grafana Cloud instance is a one-click install; same with updates. Cool, right?
Note that it could take up to 1 minute to see the plugin show up in your Grafana.
Installing plugins on a Grafana Cloud instance is a one-click install; same with updates. Cool, right?
Note that it could take up to 1 minute to see the plugin show up in your Grafana.
Warning
Plugin installation from this page will be removed in February 2026. Use the Plugin Catalog in your Grafana instance instead. Refer to Install a plugin in the Grafana documentation for more information.
Installing plugins on a Grafana Cloud instance is a one-click install; same with updates. Cool, right?
Note that it could take up to 1 minute to see the plugin show up in your Grafana.
For more information, visit the docs on plugin installation.
Installing on a local Grafana:
For local instances, plugins are installed and updated via a simple CLI command. Plugins are not updated automatically, however you will be notified when updates are available right within your Grafana.
1. Install the Application
Use the grafana-cli tool to install Grafana Metrics Drilldown from the commandline:
grafana-cli plugins install The plugin will be installed into your grafana plugins directory; the default is /var/lib/grafana/plugins. More information on the cli tool.
Alternatively, you can manually download the .zip file for your architecture below and unpack it into your grafana plugins directory.
Alternatively, you can manually download the .zip file and unpack it into your grafana plugins directory.
2. Enable it
Next, log into your Grafana instance. Navigate to the Plugins section, found in your Grafana main menu.
Click the Apps tabs in the Plugins section and select the newly installed app.
To enable the app, click the Config tab. Follow the instructions provided with the application and click Enable. The app and any new UI pages are now accessible from within the main menu, as designed by the app creator.
If dashboards have been included with the application, they will attempt to be automatically installed. To view the dashboards, re-import or delete individual dashboards, click the Dashboards tab within the app page.
Changelog
2.0.1
Chores
- deps:
- Pin dependencies (#1168) (ceb93c7c)
- update grafana/plugin-ci-workflows/ci-cd-workflows action to v7.0.0 (#1161) (12a1c041)
- Update actions/upload-artifact action to v7 (#1157) (140fbe3a)
- Update docker.io/prom/prometheus Docker tag to v3.10.0 (#1155) (aecd1fee)
- Update Build tools (#1169) (c9b845bf)
- Update dependency @grafana/plugin-e2e to v3.4.10 (#1152) (f30a3ef9)
- Update TypeScript and linting (#1170) (2a8b7df4)
- Update pnpm to v10.33.0 (#1171) (55dd1db3)
- Update dependency minimatch@^9 to v10 (#1159) (f25dd9fc)
- Update TypeScript and linting (#1154) (5164b27d)
- Update pnpm to v10.32.1 (#1156) (6ed18a4b)
- Update dependency webpack-cli to v7 (#1160) (90607a85)
- combine all Renovate dependency updates (#1150) (6863852c)
- assign @grafana/docs-metrics as codeowners for docs (#1164) (39871b0d)
- remove disabled Settings section from sidebar (#1143) (b776da2e)
- add GitNexus dev tooling (#1147) (304e8d33)
Documentation Changes
- Update menu title and weight in _index.md (#1178) (cd9e487a)
New Features
- units: expand unit detection with hardware, energy, and ratio s… (#1176) (5b2a73f1)
- add Knowledge Graph annotation overlays (#1173) (4e384aa0)
Bug Fixes
- add entry in CODEOWNERS for the docs (#1180) (c0349175)
- publish to catalog workflow (#1174) (d75c1d95)
- pin versions to fix
pnpm audit(#1166) (85ced206) - populate datasource filter in LoadQueryScene (#1139) (deb3cd77)
- deps:
- resolve lodash CVEs (CVE-2026-4800, CVE-2026-2950) (#1177) (904f7093)
- resolve
pnpm auditvulnerabilities in `serialize-javascr… (#1172) (d3993afd) - override flatted and undici to resolve Trivy CVEs (#1151) (8ee55901)
- goff: use subpath in the openfeature api url (#1167) (44e977e1)
Other Changes
- Download translations from Crowdin (#1179) (9ec556b1)
- Download translations from Crowdin (#1163) (5bba679d)
Performance Improvements
- Lazy-load Faro in module.tsx (#1162) (f6f6f655)
2.0.0
Chores
- upgrade to React 19 for Grafana 13 compatibility (#1128) (dcc4215a)
Documentation Changes
- Update docs for latest UI changes (#1141) (d36c5ee4)
Bug Fixes
- ci: add pull-requests read permission to CD workflow (#1149) (86fac9e2)
1.0.34
Chores
- deps:
- Update dependency copy-webpack-plugin to v14 (#1120) (41869e6c)
- Update dependency @react-aria/utils to v3.33.1 (#1119) (745d8944)
- Update TypeScript and linting (major) (#1111) (1f06969f)
- Update pnpm to v10.30.3 (#1107) (5ce4565f)
New Features
- extensions: migrate DashboardPanelMenu from category to group API (#1121) (2350e210)
Bug Fixes
- breadcrumb navigation issue (#1126) (4261601b)
- filter native histogram zero-bucket-only frames to prevent heatmap crash (#1127) (0d847bdb)
- resolve CVE-2026-3449 (@tootallnate/once) (#1125) (a8908a1c)
- resolve high CVEs in transitive dependencies (#1122) (9eed652c)
- filter "" and '' values as empty matchers like
label!=""(#1118) (ebe53941)
1.0.33
New Features
- fix saved queries instrumentation, fix dead path events (#1115) (3801bff6)
- add create alert event for tracking (#1114) (e44b28d2)
Bug Fixes
- filter empty native histogram heatmap frames to prevent OOM crash (#1116) (d491acaf)
Other Changes
- Download translations from Crowdin (#1103) (755a5192)
1.0.32
Chores
- i18n: Expose all supported languages in plugin.json (#1096) (cb9f88e0)
- update grafana dependencies to v12.4.0 (#1098) (52b88597)
- deps:
- Lock file maintenance (#1094) (9ec9e703)
- Update dependency css-loader to v7.1.4 (#1090) (1b4a293a)
- Update dependency @grafana/plugin-e2e to v3.3.2 (#1089) (5a880cae)
- Update dependency glob to v13.0.6 (#1091) (ccd140d6)
- Update TypeScript and linting (#1093) (c924cce1)
- Update pnpm to v10.30.1 (#1092) (b160d37b)
New Features
- add saved queries (#1064) (14ba8ac2)
- show dashboard sort limit warning (#1088) (2f2a6150)
- expose embeded metrics component (#782) (0c726307)
Bug Fixes
- native histogram can sum by le without effect (#1101) (b675b97e)
Other Changes
- Download translations from Crowdin (#1087) (7597632d)
1.0.31
Chores
- docker: support appending feature toggles and fix alert rules (#1083) (17e410e6)
- deps:
- Update dependency glob to v13.0.3 (#1077) (49253934)
- Update dependency @types/node to v24.10.13 (#1075) (cf871a47)
- Update dependency dotenv to v17.3.1 (#1076) (be33a6da)
- Update dependency webpack to v5.105.2 (#1078) (3e356546)
- Update dependency @playwright/test to v1.58.2 (#1074) (da5349e2)
- Update TypeScript and linting (#1080) (283a2720)
- Update pnpm to v10.29.3 (#1079) (7470035c)
- Update dependency @grafana/plugin-e2e to v3.3.0 (#1073) (eedbcf51)
- remove Docker-based Playwright in favor of node-based execution (#1065) (b982b661)
Documentation Changes
- remove Docker-based screenshot testing documentation (#1072) (e584da65)
Other Changes
- Download translations from Crowdin (#1069) (071cc911)
1.0.30
Chores
- deps:
- Update actions/checkout digest to de0fac2 (#1049) (2c26f3ec)
- Update dependency @react-aria/utils to v3.33.0 (#1054) (699d38c2)
- Update dependency glob to v13.0.1 (#1052) (c8aeb0bd)
- Update dependency @grafana/plugin-e2e to v3.2.1 (#1053) (a486bef1)
- Update dependency @playwright/test to v1.58.1 (#1050) (9d4a4b78)
- Update Build tools (#1055) (49a20d88)
- Update Node.js to v24 (#1056) (a9b100c6)
- Update docker.io/prom/prometheus Docker tag to v3.9.1 (#1005) (8fddce3c)
- Update dependency glob to v13 (#1008) (e41c5c8a)
- Update GitHub Actions to v6 (major) (#1011) (7d64b118)
- Update dependency p-limit to v7 (#1010) (e6064e2f)
- Update dependency globals to v17 (#1009) (e4ed1075)
- Update dependency dotenv to v17 (#1007) (478b5946)
- Update dependency @react-aria/utils to v3.32.0 (#1004) (9fefd1cb)
- Update TypeScript and linting (#1006) (eb1f8596)
- Update Build tools (#1003) (ec5fc881)
- Update GitHub Actions (#866) (b018293f)
- Update Build tools (major) (#920) (04ab0c97)
- Update TypeScript and linting (#918) (c726d3d1)
- Update Build tools (#876) (7cadc84c)
- updates nvmrc node version to lts (#1060) (0c91fa7a)
- update pnpm version to 10.28.2 (#1034) (ce3678e5)
- update feedback form url (#1026) (297a0d20)
- add I18n title for crowdin PRs (#1025) (71d053e0)
- Download translations from Crowdin (#1024) (fb04868d)
- update outdated dependencies with pnpm update (#995) (616e16b8)
- i18n: point i18n actions back to main (#1045) (2f51fdc7)
Continuous Integration
- update workflow to use latest from upstream (#1047) (71f479a4)
- grant pull-requests write permission for PR labeling (#1036) (6e1cdcba)
Documentation Changes
- update to reflect Label API limit (#955) (88605290)
- add context about the app's intent and structure (#970) (857f508c)
New Features
- add Query Results tab with instant query table view (#865) (#910) (c9fa9535)
Bug Fixes
- make logs-drilldown volume path configurable for git worktrees (#1062) (58778a9d)
- increase grafana-scopes-gmd healthcheck timings to reduce CI flakiness (#1014) (1ecc258a)
- sidebar: avoid empty-label option in Group by labels on first render (#1044) (1a5e06cc)
- a11y:
- Support WCAG 2.1 Level A 2.4.3 Focus Order (#1046) (49be0829)
- add consistent help controls to Onboarding and ErrorView (#1042) (a3b3c049)
- add aria-label to search inputs for WCAG 3.3.2 compliance (#1027) (9905f863)
- add aria-labels and improve descriptions for WCAG 2.4.6 (#998) (432386c2)
- add aria-label and aria-expanded for WCAG 4.1.2 compliance (#1015) (bf8ec866)
- include visible text in aria-label for text-based sidebar button (#984) (9bf1f155)
- add aria-label to Prometheus function config radio inputs (#996) (1dc5061c)
- associate label with Hide empty toggle switch (#986) (3c9e438f)
- i18n: correct plural formatting for translations (#1033) (73f2b21b)
- ci: use pull_request_target to allow labeling fork PRs (#1030) (018cd67a)
- deps: resolve 4 security vulnerabilities (#1031) (443cd223)
Other Changes
- Download translations from Crowdin (#1063) (30dde0c2)
- Download translations from Crowdin (#1061) (ee08d88e)
- Download translations from Crowdin (#1035) (255d0b0d)
Tests
- optimize e2e test patterns (#997) (c4000e1b)
- add tests for getMetricType and getPanelTypeForMetric functions (#1013) (c08f4a45)
- fix flaky panel assertion e2e tests (#993) (189d7b0a)
1.0.29
Chores
- deps:
- Update pnpm to v10.28.2 [SECURITY] (#990) (2ddab3b7)
- Pin mcr.microsoft.com/playwright Docker tag to 35c7d48 (#914) (c9da3f25)
- Update dependency @grafana/plugin-e2e to v3 (#939) (2418890b)
- Update actions/upload-artifact action to v6 (#919) (bf086f6e)
- Update dependency sass to v1.97.3 (#916) (d2cbe54a)
- update grafana/shared-workflows/get-vault-secrets action to v1.3.0 (#917) (709836ed)
- Update dependency @types/node to v20.19.30 (#915) (7ebb4784)
- migrate from npm to pnpm (#957) (2bdf5944)
- Download translations from Crowdin (#975) (0a18c236)
- quick search assistant experiment (#959) (531b187f)
- migrate eslint config to
.mjs(#962) (052ef827) - merge eslint-plugin-jsx-a11y into main eslint config (#956) (408f2f47)
- update @grafana/create-plugin to v6.7.5 (#929) (6591e4f6)
- i18n: add crowdin github actions (#942) (8d6b8783)
- eslint: add @grafana/i18n rules (#926) (140798ec)
New Features
- Knowledge Graph source metrics enhancements (#958) (2201b01e)
- create alert from metric scene (#937) (8a90598a)
Bug Fixes
- ci:
- remove double dashes (#992) (0a36e456)
- remove extraneous
--in bundle stats script (#991) (1e57122c)
- update i18n-extract to use i18next-cli (#987) (e0fccfc3)
- add webpack alias for @grafana/i18n to resolve pnpm module duplication (#985) (7bf7d895)
Refactors
- leverage disco union for improved type safety (#960) (4358c90b)
1.0.28
Chores
- add eslint-plugin-jsx-a11y and fix a11y violations (#924) (a805a40a)
- handle TODOs (#864) (26615aa9)
- add @grafana/i18n (#868) (86af4387)
- Remove investigations (#902) (8ae002f3)
- deps:
- Update docker.io/prom/prometheus Docker tag to v3.8.1 (#838) (9fb8c24d)
- Update dependency @prometheus-io/lezer-promql to ^0.308.0 (#877) (d738973a)
Continuous Integration
- upgrade shared workflows dependency (#909) (f362aa6f)
New Features
- mini drilldown grafana assistant navigation integration (#899) (404db242)
- assistant quicksearch integration to ask a question (#908) (0721bcce)
Bug Fixes
- bump @remix-run/router (#912) (a508afe5)
- group by utf8 label (#906) (77d6b227)
1.0.27
Chores
- adds "Resolves <link to issue>" so github automatically resolves issues (#895) (0e4d8765)
Bug Fixes
- cve: update qs subdependency (#900) (4f8fbb5f)
- OpenFeature: gracefully degrade when OFREP endpoint is unavailable (#898) (9f7a7145)
1.0.26
Chores
- replace hardcoded constant with enum (#890) (fecb8ebd)
- add OpenFeature context to sidebar analytics (#893) (15980697)
- use PluginExtensionPoints constant from @grafana/data (#874) (648b4160)
- add
openFeaturecontext (#891) (fb7d6934)
Continuous Integration
- bump shared workflows to
4.3.0(#885) (8ec2aafc)
New Features
- implement the tree filter experiment with open feature (#892) (33594f07)
- init OpenFeature flag evaluations (#886) (7d68f7bf)
- assistant integration fast follow (#888) (caeed347)
1.0.25
Chores
- deps: Update dependency @types/node to v20.19.25 (#875) (a2a56193)
New Features
- assistant: add entry point to grafana assistant from metric scene (#883) (2f44ce5f)
- add exposed component for Knowledge Graph source metrics (#873) (120ff2d6)
Bug Fixes
- handle non-error object with
message(#879) (0a92be94)
1.0.24
Chores
- bump playwright to v1.57.0 (#869) (43d070ea)
- add renovate.json (#859) (2bcf0f8b)
Bug Fixes
- manually revert lazy loading promql parser (#867) (76a733a9)
1.0.23
Chores
- deps: update dependency @grafana/faro-web-sdk to v2.0.2 (#854) (be2772dc)
- playwright only screenshot major versions (#860) (161ba87c)
- bump js-yaml from 3.14.1 to 3.14.2 (#857) (c6b07868)
- bump glob from 10.4.5 to 11.1.0 in the npm_and_yarn group across 1 directory (#855) (a2c8711c)
New Features
- filters: simple tree filter for prefix filters (#858) (750af7cd)
Bug Fixes
- deps: update dependency @bsull/augurs to ^0.10.0 (#842) (d88b79e0)
Tests
- loosen up playwright screenshot version check (#826) (d2b36b72)
1.0.22
1.0.21
Chores
- rm pre-version script check (#844) (bb4155ee)
- deps:
- update dependency eslint-config-prettier to v8.10.2 (#833) (570048e3)
- update dependency @types/node to v20.19.24 (#832) (cad8a0e3)
- update dependency webpack to v5.102.1 (#837) (716ca1ad)
- update dependency @grafana/assistant to v0.1.3 (#831) (8b75b59f)
- update dependency @grafana/scenes to v6.42.2 (#834) (15cf1df3)
- update dependency @grafana/tsconfig to v2.0.1 (#825) (05949515)
- update dependency typescript to v5.9.3 (#817) (de5ed58e)
- update dependency @swc/core to v1.14.0 (#812) (d2b54f48)
- update dependency sass to v1.93.3 (#815) (56dbac3e)
- update dependency leven to v4.1.0 (#814) (0543e672)
- pin dependencies (#785) (c8b31460)
New Features
- add breadcrumbs (#810) (12cc8fa4)
- MetricsList: Remove configure Prometheus function button (#821) (833a4fba)
Bug Fixes
- update query with duplicate utf-8 metric names (#839) (fa366df7)
- Breakdown: Fix missing panel data (#828) (fb277012)
- Sidebar:
- Remove extra space and border radius (#823) (bfc38b7e)
- PluginInfo: Fix missing Prometheus info (#822) (baa5fbb3)
v1.0.20
See https://github.com/grafana/metrics-drilldown/releases/tag/v1.0.20
v1.0.19
See https://github.com/grafana/metrics-drilldown/releases/tag/v1.0.19
v1.0.18
See https://github.com/grafana/metrics-drilldown/releases/tag/v1.0.18
v1.0.17
See https://github.com/grafana/metrics-drilldown/releases/tag/v1.0.17
v1.0.16
See https://github.com/grafana/metrics-drilldown/releases/tag/v1.0.16
v1.0.15
See https://github.com/grafana/metrics-drilldown/releases/tag/v1.0.15
v1.0.14
See https://github.com/grafana/metrics-drilldown/releases/tag/v1.0.14
v1.0.13
See https://github.com/grafana/metrics-drilldown/releases/tag/v1.0.13
v1.0.12
See https://github.com/grafana/metrics-drilldown/releases/tag/v1.0.12
v1.0.11
See https://github.com/grafana/metrics-drilldown/releases/tag/v1.0.11
v1.0.10
See https://github.com/grafana/metrics-drilldown/releases/tag/v1.0.10
v1.0.9
See https://github.com/grafana/metrics-drilldown/releases/tag/v1.0.9
v1.0.8
See https://github.com/grafana/metrics-drilldown/releases/tag/v1.0.8
v1.0.7
See https://github.com/grafana/metrics-drilldown/releases/tag/v1.0.7
v1.0.6
See https://github.com/grafana/metrics-drilldown/releases/tag/v1.0.6
v1.0.5
See https://github.com/grafana/metrics-drilldown/releases/tag/v1.0.5
v1.0.4
See https://github.com/grafana/metrics-drilldown/releases/tag/v1.0.4
v1.0.3
See https://github.com/grafana/metrics-drilldown/releases/tag/v1.0.3-corrected
v1.0.2
See https://github.com/grafana/metrics-drilldown/releases/tag/v1.0.2
v1.0.2-0
See https://github.com/grafana/metrics-drilldown/releases/tag/v1.0.2-0
1.0.1
See https://github.com/grafana/metrics-drilldown/releases/tag/v1.0.1
1.0.0
See https://github.com/grafana/metrics-drilldown/releases/tag/v1.0.0
1.0.0-9
See https://github.com/grafana/metrics-drilldown/releases/tag/v1.0.0-9
1.0.0-8
See https://github.com/grafana/metrics-drilldown/releases/tag/v1.0.0-8
1.0.0-7
See https://github.com/grafana/metrics-drilldown/releases/tag/v1.0.0-7
1.0.0-6
See https://github.com/grafana/metrics-drilldown/releases/tag/v1.0.0-6
1.0.0-5
See https://github.com/grafana/metrics-drilldown/releases/tag/v1.0.0-5
1.0.0-4
See https://github.com/grafana/metrics-drilldown/releases/tag/v1.0.0-4
1.0.0-3
See https://github.com/grafana/metrics-drilldown/releases/tag/v1.0.0-3
1.0.0-2
See https://github.com/grafana/metrics-drilldown/releases/tag/v1.0.0-2
1.0.0-1
See https://github.com/grafana/metrics-drilldown/releases/tag/v1.0.0-1
1.0.0-0
See https://github.com/grafana/metrics-drilldown/releases/tag/v1.0.0-0
0.1.0
Initial release.