Plugins 〉Factry Historian Datasource


Factry Historian Datasource


Factry Historian Datasource
The Factry Historian datasource plugin for Grafana allows you to seamlessly visualize time-series and event data collected and stored by Factry Historian. Connect your Historian instance and start building dashboards with your industrial data in minutes.
⚡ New to Factry Historian? If you don’t have Factry Historian running yet, no problem! You can quickly trial the software using a ready-to-run docker-compose setup. It spins up a local Historian instance with a 2-hour runtime limit, perfect for testing the Grafana datasource and exploring your data without installing anything permanently.
⚠️ Warning: Before upgrading this datasource, make sure to read the changelog to understand any breaking changes or required migration steps. For every new release we will support at least the two latest major versions of Grafana.
Features
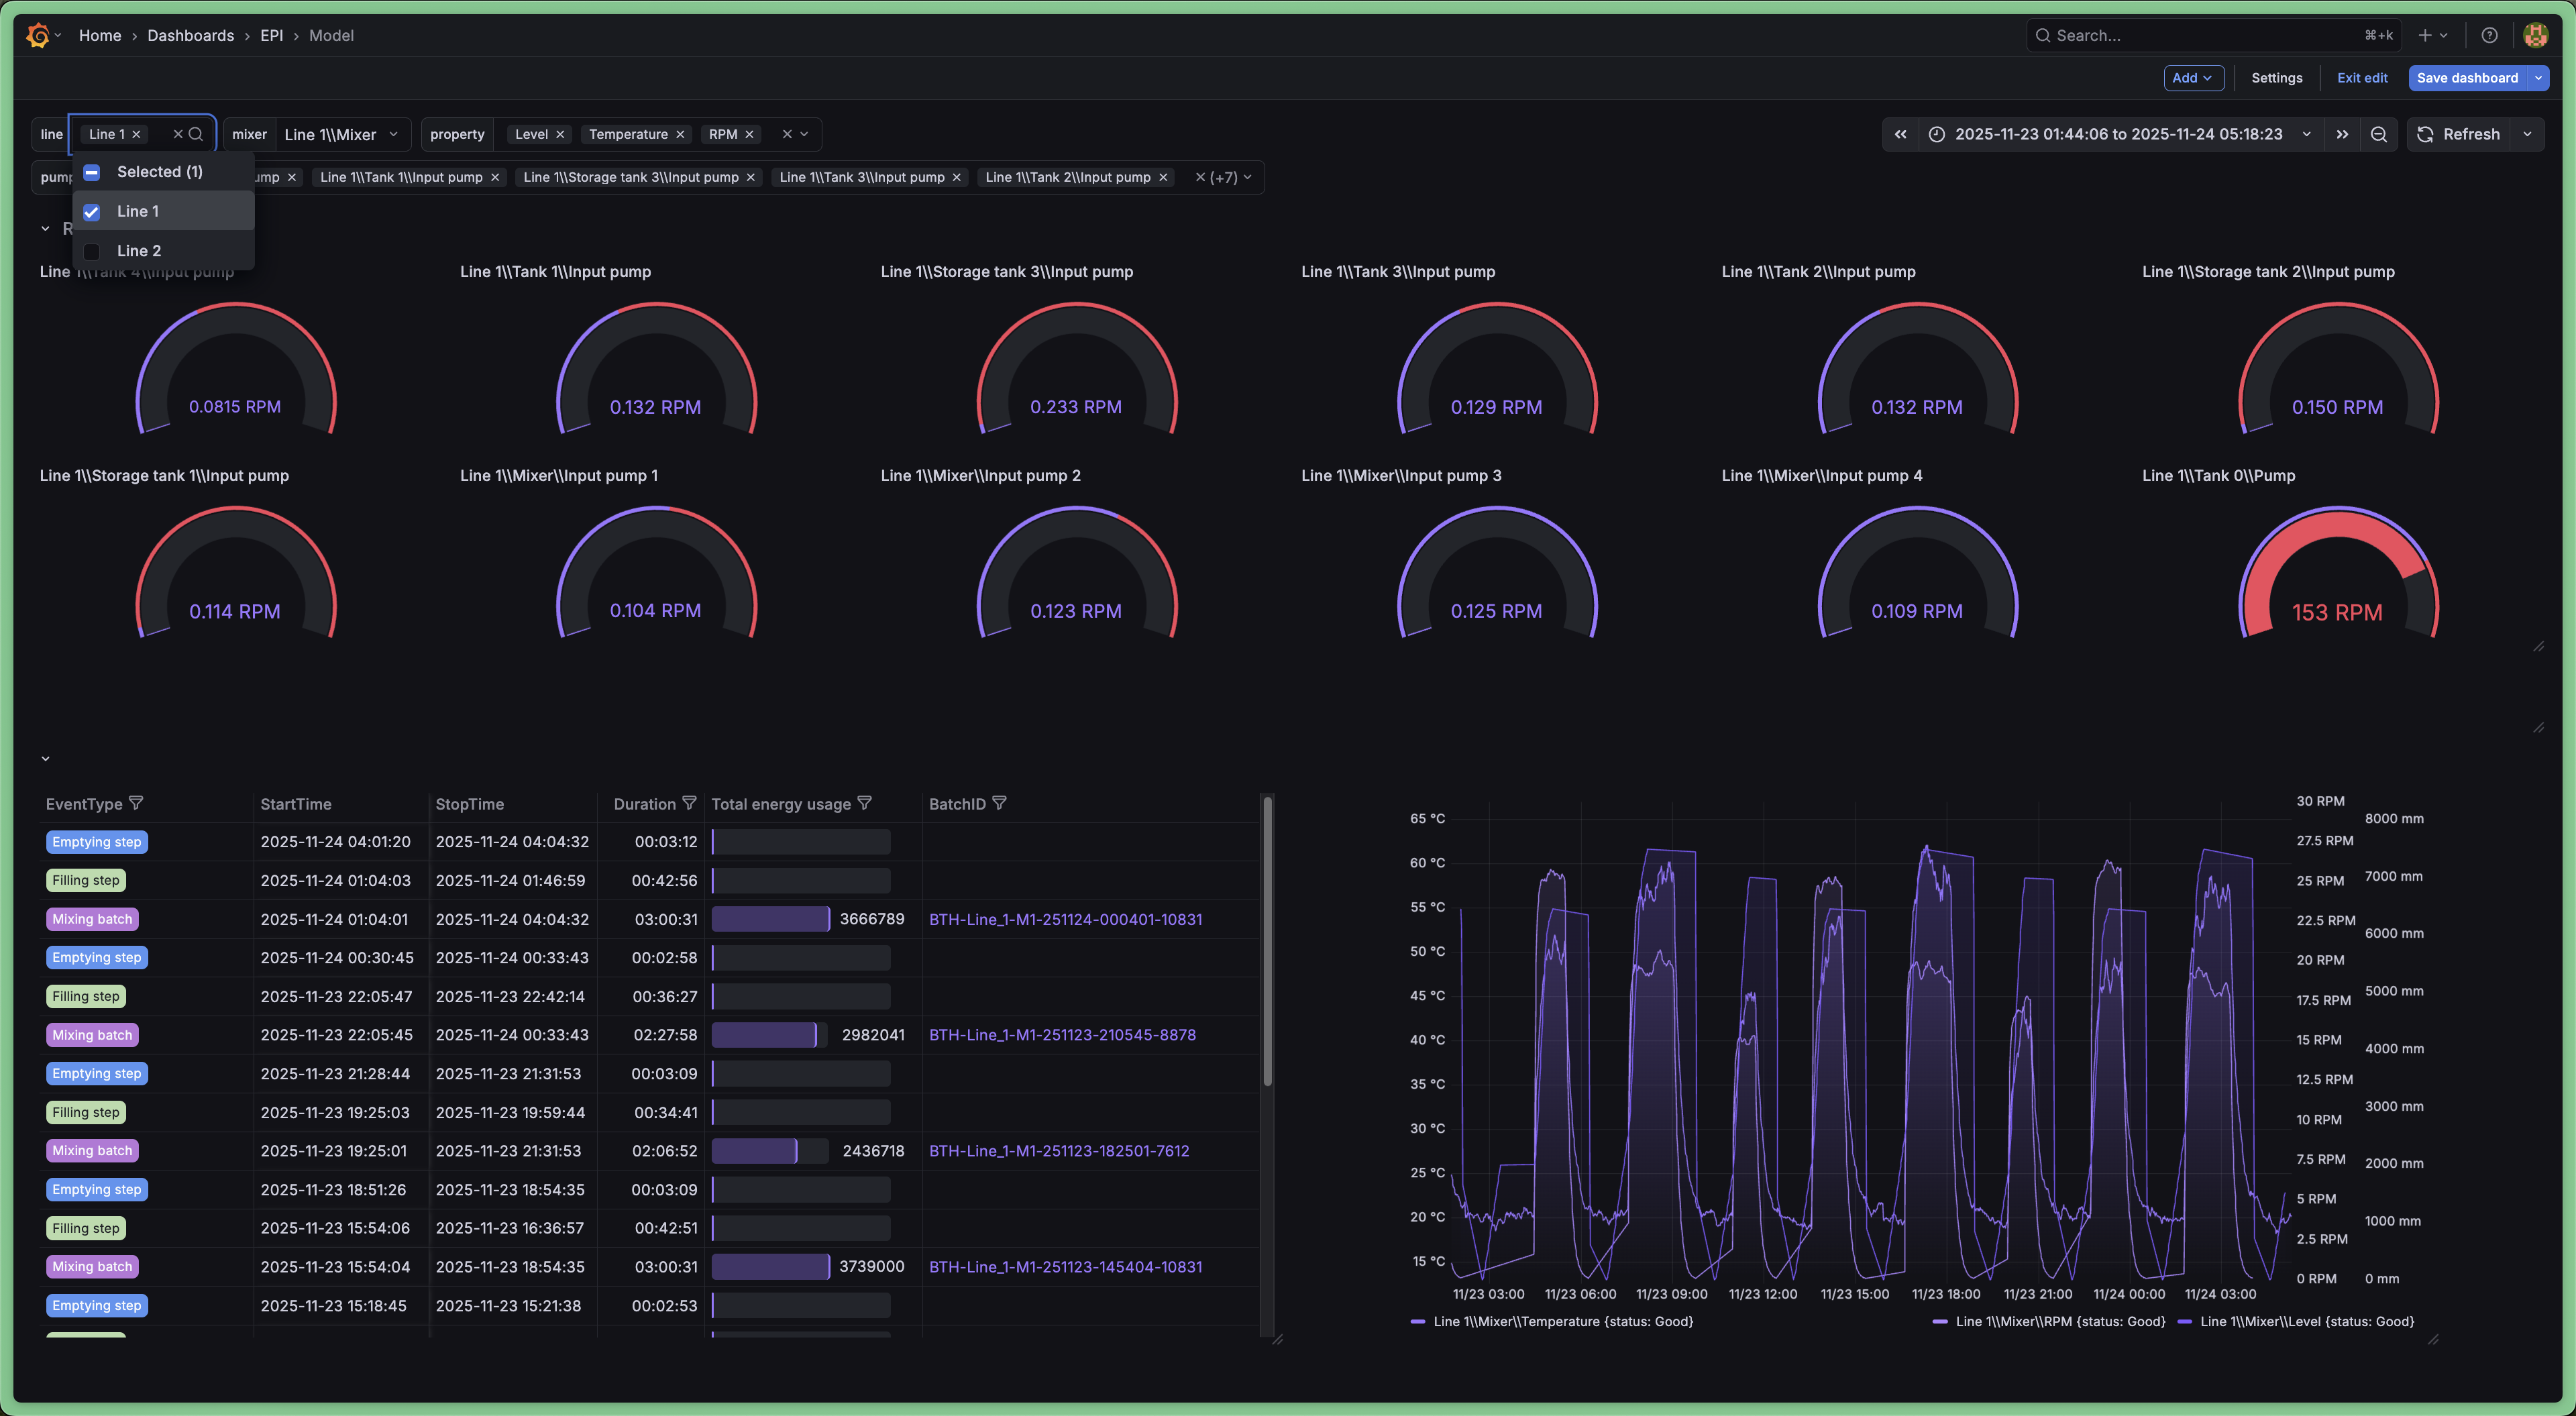
- Query historical data using the asset tree defined in Factry Historian
- Query historical data using measurements from Factry Historian
- Autoload units of Measurement, Y-axis scaling and HI/LO boundaries
- Query Events from Factry Historian (e.g. batches, CIP cycles)
- Annotate trends with Event data from Factry Historian
- Use assets, measurements and events from Factry Historian as variables to build dynamic dashboards
Typical use cases
- Browsing your asset structure (e.g. ISA88/ISA95 equipment model)
- Trending time-series data, while auto-configuring units of measurement
- Overlaying of events (e.g. golden batch analysis)
- Ad-hoc overlaying of time-series data on top of events
Getting Started
1. Install Factry Historian
If you don't have a licensed version of Factry Historian, you can try it for yourself with a trial. Go to https://github.com/factrylabs/historian to download your copy and run it locally.
2. Install the Factry Historian datasource plugin
Install the datasource in Grafana by navigating to Home > Administration > Plugins and data > Plugins and searching for "Factry" there.
Alternatively, you can install it using the grafana-cli or by cloning the repository directly into the Grafana plugins directory.
grafana-cli plugins install factry-historian-datasource
3. Configure the datasource
Create a new instance of the data source from the Grafana Data Sources administration page and configure the necessary settings.
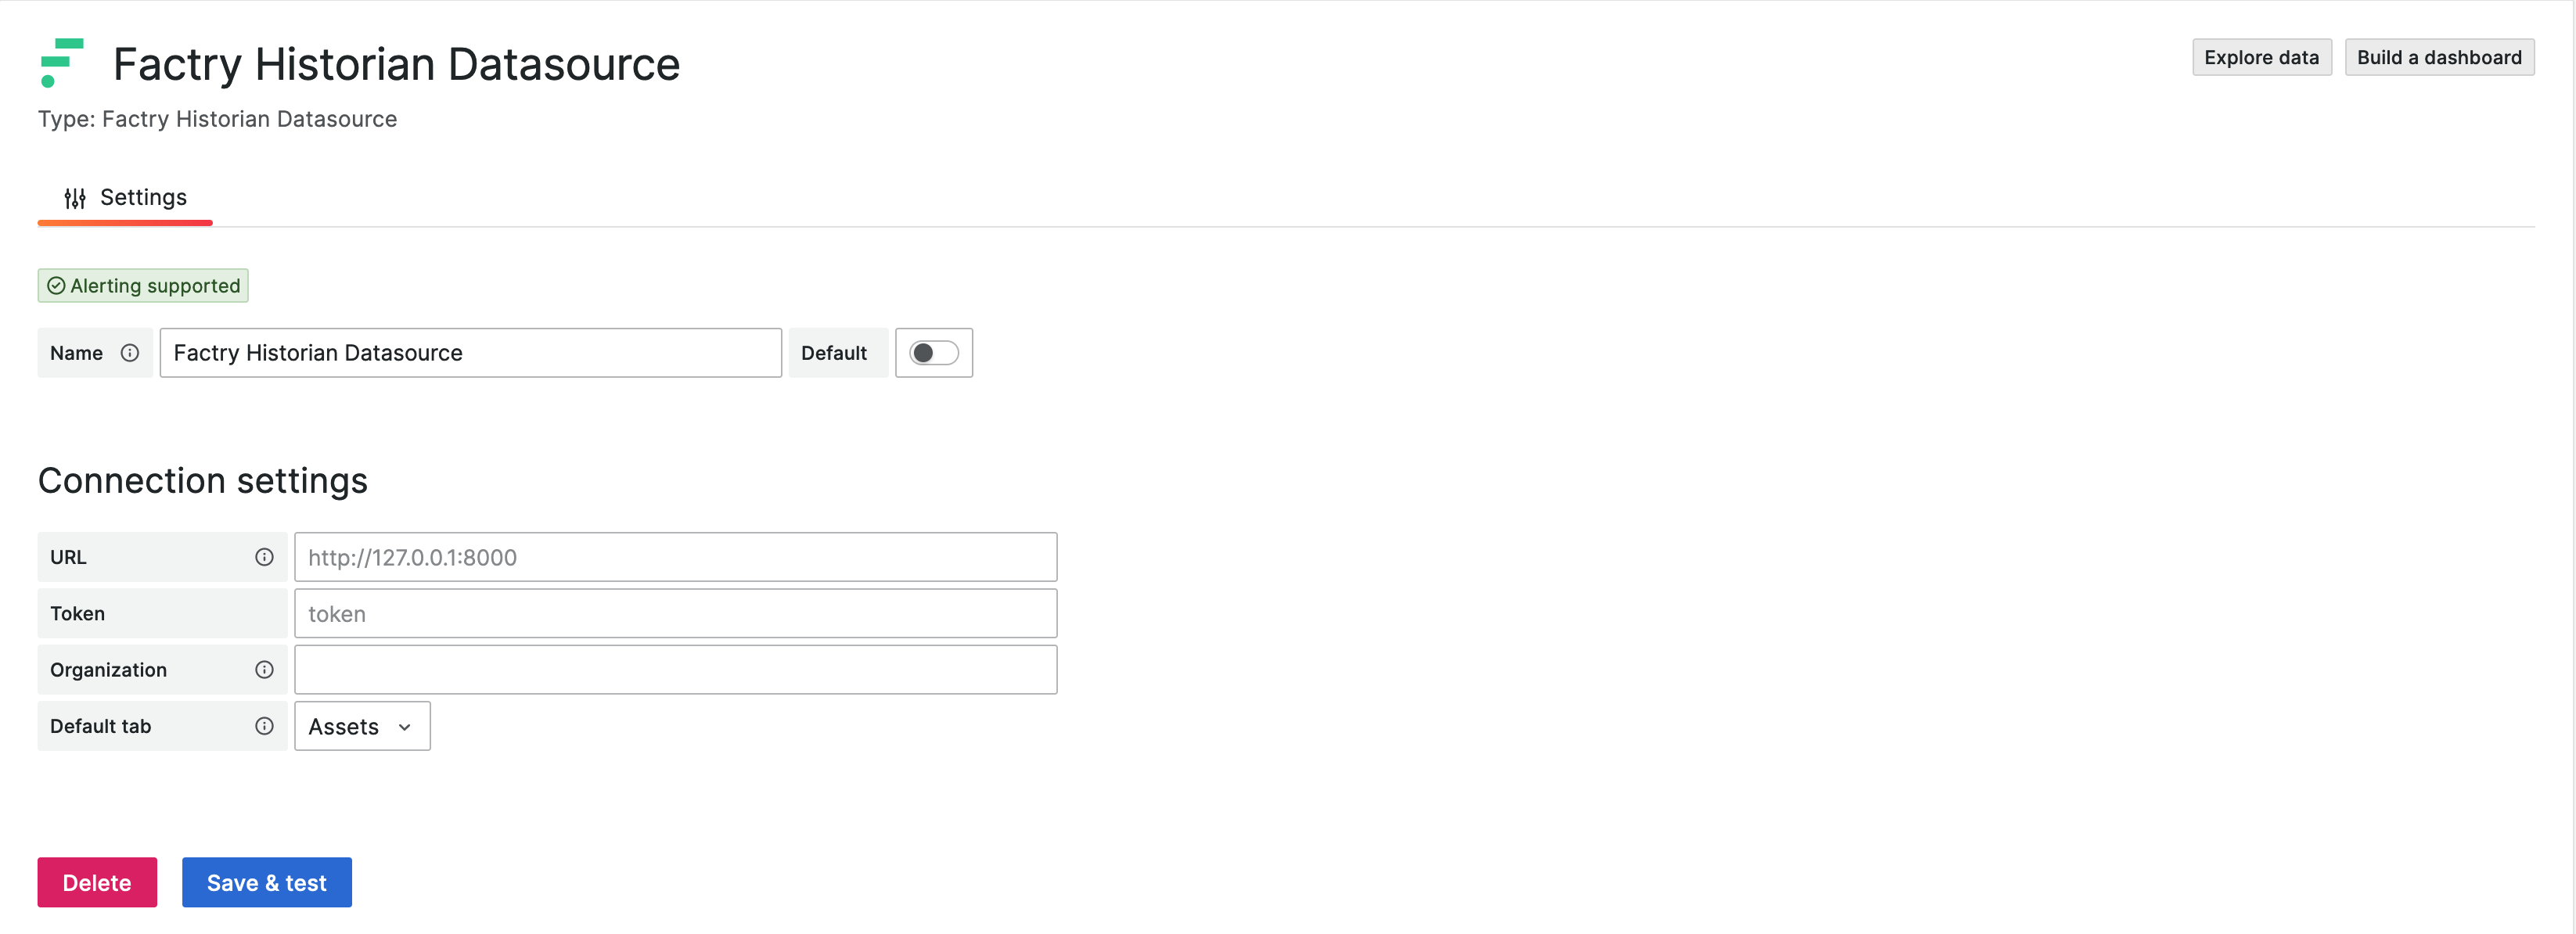
- URL: The URL of the Factry Historian API (e.g. http://localhost:8000 or http://historian:8000 when running in Docker)
- Token: The API token to authenticate with the Factry Historian API
- Organization: The UUID of the organization to query data from
- Default tab: The default tab to show when opening the query editor
A full step-by-step guide can be found in the 'Configuring the Factry Historian Datasource' How-To.
Documentation
Other documentation can be found at the Factry documentation site: https://docs.factry.io/reference/factry-historian-datasource-plugin-for-grafana
Questions?
For help, visit: Factry Community https://www.reddit.com/r/Factry/ Factry Knowledge Base https://docs.factry.io
Grafana Cloud Free
- Free tier: Limited to 3 users
- Paid plans: $55 / user / month above included usage
- Access to all Enterprise Plugins
- Fully managed service (not available to self-manage)
Self-hosted Grafana Enterprise
- Access to all Enterprise plugins
- All Grafana Enterprise features
- Self-manage on your own infrastructure
Installing Factry Historian Datasource on Grafana Cloud:
Installing plugins on a Grafana Cloud instance is a one-click install; same with updates. Cool, right?
Note that it could take up to 1 minute to see the plugin show up in your Grafana.
Warning
Plugin installation from this page will be removed in February 2026. Use the Plugin Catalog in your Grafana instance instead. Refer to Install a plugin in the Grafana documentation for more information.
Installing plugins on a Grafana Cloud instance is a one-click install; same with updates. Cool, right?
Note that it could take up to 1 minute to see the plugin show up in your Grafana.
Installing plugins on a Grafana Cloud instance is a one-click install; same with updates. Cool, right?
Note that it could take up to 1 minute to see the plugin show up in your Grafana.
Warning
Plugin installation from this page will be removed in February 2026. Use the Plugin Catalog in your Grafana instance instead. Refer to Install a plugin in the Grafana documentation for more information.
Installing plugins on a Grafana Cloud instance is a one-click install; same with updates. Cool, right?
Note that it could take up to 1 minute to see the plugin show up in your Grafana.
For more information, visit the docs on plugin installation.
Installing on a local Grafana:
For local instances, plugins are installed and updated via a simple CLI command. Plugins are not updated automatically, however you will be notified when updates are available right within your Grafana.
1. Install the Data Source
Use the grafana-cli tool to install Factry Historian Datasource from the commandline:
grafana-cli plugins install The plugin will be installed into your grafana plugins directory; the default is /var/lib/grafana/plugins. More information on the cli tool.
Alternatively, you can manually download the .zip file for your architecture below and unpack it into your grafana plugins directory.
Alternatively, you can manually download the .zip file and unpack it into your grafana plugins directory.
2. Configure the Data Source
Accessed from the Grafana main menu, newly installed data sources can be added immediately within the Data Sources section.
Next, click the Add data source button in the upper right. The data source will be available for selection in the Type select box.
To see a list of installed data sources, click the Plugins item in the main menu. Both core data sources and installed data sources will appear.
Changelog
v3.0.1
Bug fixes
- Fixed an issue escaping special characters when calling the historian API
- Fixed the asset selection cascader only showing root level assets
v3.0.0
⚠️ Breaking changes
- Dropped support for Grafana versions earlier than 11.0
Changes
- Improve handling of dimension event properties in event queries when also querying asset properties
- Added options to order time series and events queries by both ascending and descending time
- Performance improvements when editing panels with multiple queries
Bug fixes
- Fixed regex selection for measurements not always working correctly
- Filter out UUIDs from other datasources in query displays
- Fixed possible panic in the event query
- Sort labels to ensure consistent ordering of series in the frontend
v2.4.0
Changes
- Added option to align the start of an aggregation to the start of the query interval or to the truncated aggregation interval.
- Added option to override limit filter for measurement queries in dashboard variables.
- Updated the max measurements setting for measurement queries to be unlimited if set to 0.
Bug fixes
- Avoid duplicate columns when a parent event has the same periodic property as the child event in event queries.
v2.3.2
Bug fixes
- Fixed an issue where dashboard variables of type Event Property Values could break if the configured Event Type was also a variable.
v2.3.1
Bug fixes
- Fixed dashboard variables of type Event Property Values not being migrated correctly and breaking dashboards
v2.3.0
Changes
- Changed minimum Grafana version to 10.4.0
- Added support for time weighted average aggregation for historian version v7.3.0 and later.
- If no asset properties are selected in the assets query editor or in the events query editor, the query will now return data for all asset properties instead of no asset properties
- Changed default unit for event duration column to use
dtdhmsformat - Refresh data from Factry Historian when opening a selection field instead of only on dashboard load
- Added keyword and datatype filter for asset property variable query editor
- Debounce keyword searches in variable query editors to reduce query load
- Show asset path in asset property variable query editor to help distinguish between properties on assets with the same name but different paths
- Added a configurable limit to the events query editor to limit the amount of events returned, default is 1000, 0 means no limit
- Allow to select which parent event properties to include in the result and allow to filter on them
- Added event duration filter to the event query editor, also works with parent events
- Allow use of dashboard variables in measurement regex queries
- Moved settings related to aggregations and grouped them together
- Added filtering on datatypes for measurement, asset property and event type property queries
- Added an
Override time rangeoption to the event query editor - Enabled support for sql expressions
- Filter out selected event types and asset properties when changing the selected assets
- Add the option to override assets to select asset properties on in the event query editor
Bug fixes
- Fixed multi value filter for the event property values query
- Updating the selected databases in a measurement query will now correctly update the available measurements
- Fixed the display name for raw queries
- Fixed an issue when selecting parent event properties in the event query editor
- Don't show an error if the query returns no results
- Fixed UoM not being set for asset properties in event queries
- Fixed the use of dashboard variables in event property values variable queries
- Fixed a potential panicy race condition in the query handler that could be triggered by executing multiple queries.
v2.2.0
Changes
- Introduced the ability to include parent event information in event queries.
- Implemented support for event property value filters compatible with v7.2.0.
- Added an option to only return changed values in measurement queries.
- Added support for event properties with dimensions in event queries.
- Description of measurements and or asset properties are now available as labels in query results.
Bug Fixes
- Checked the validity of regular expressions before sending them to the historian.
- Fixed issues with custom interval selection in the event query.
- Fixed an issue where modifying a duplicated panel could impact the original panel.
v2.1.0
Bug Fixes
- Resolved issue where only one result was returned when multiple assets were queried in the asset property query.
- Corrected results for asset property queries using a regular expression.
- Ensured re-rendering after mount completion in the query editor.
- Fixed saving of Grafana variables in annotation queries.
- Addressed issue where aggregation reset to 'last' instead of clearing.
Changes
- Enabled aggregation over the entire time period of a dashboard.
- Added variable query for distinct event property values (requires historian > v7.2.0).
- Introduced support for value filters in time series queries (requires historian > v7.1.0).
v2.0.4
Changes
- Fixed logo in the README.
- The datasource now detects the running version of the historian and adapts to the available features.
- Error messages are now more descriptive.
- Enhanced units for event duration.
Bug Fixes
- Resolved styling issue with the dropdown cascader in the asset property query editor.
- Resolved an issue where the repeat by variable feature was malfunctioning.
v2.0.3
Changes
- Fixed filtering of event types in the event query when using a regular expression for the assets
- Fixed event queries when filtering on multiple statuses
v2.0.2
Changes
- Added 'first', 'last' and 'count' as aggregation options for array datatypes
- Fixed event property type selection
- Fixed broken link in the README
- Reworked introduction in the README
v2.0.1
Changes
- Pass datasource request context to the historian client
- Automatic instance management for data source
- Removed pprof code
v2.0.0
Changes
- Enabled annotations for events
- Added dashboard variable query editors for: measurement, databases, assets, asset properties, event types and event type properties
- Improved support for dashboard variables
- Can use everywhere where it makes sense
- Multi-value supported
- Reworked measurement selection, using a regular expression is now a toggle
- Fetch tag keys/values from the historian
- Support valid values in the event query
- Optionally query asset properties in the event query
- Improved error handling