Quickstart: instrument a Rust service with Beyla
1. Run an instrumentable Rust service
Run an instrumentable Rust service or download and run a simple example Rust HTTP service.
curl -OL https://raw.githubusercontent.com/grafana/beyla/main/examples/quickstart/rust/quickstart.rs
rustc quickstart.rs && ./quickstart
2. Download Beyla
Download the latest Beyla executable from the Beyla releases page. Uncompress and copy the Beyla executable to any location in your $PATH.
3. (Optional) get Grafana Cloud credentials
Beyla can export metrics and traces to any OpenTelemetry endpoint, as well as exposing metrics as a Prometheus endpoint. However, we recommend using the OpenTelemetry endpoint in Grafana Cloud. You can get a Free Grafana Cloud Account at Grafana’s website.
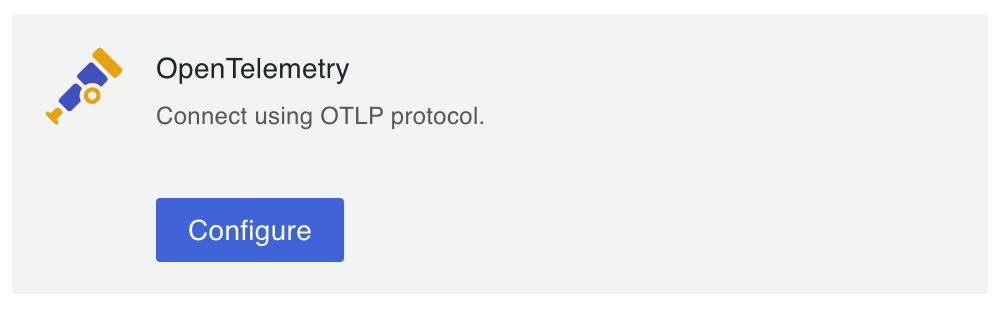
From the Grafana Cloud Portal, look for the OpenTelemetry box and click Configure.
Under Password / API token click Generate now and follow the instructions to create a default API token.
The Environment Variables will be populated with a set of standard OpenTelemetry environment variables which will provide the connection endpoint and credentials information for Beyla.
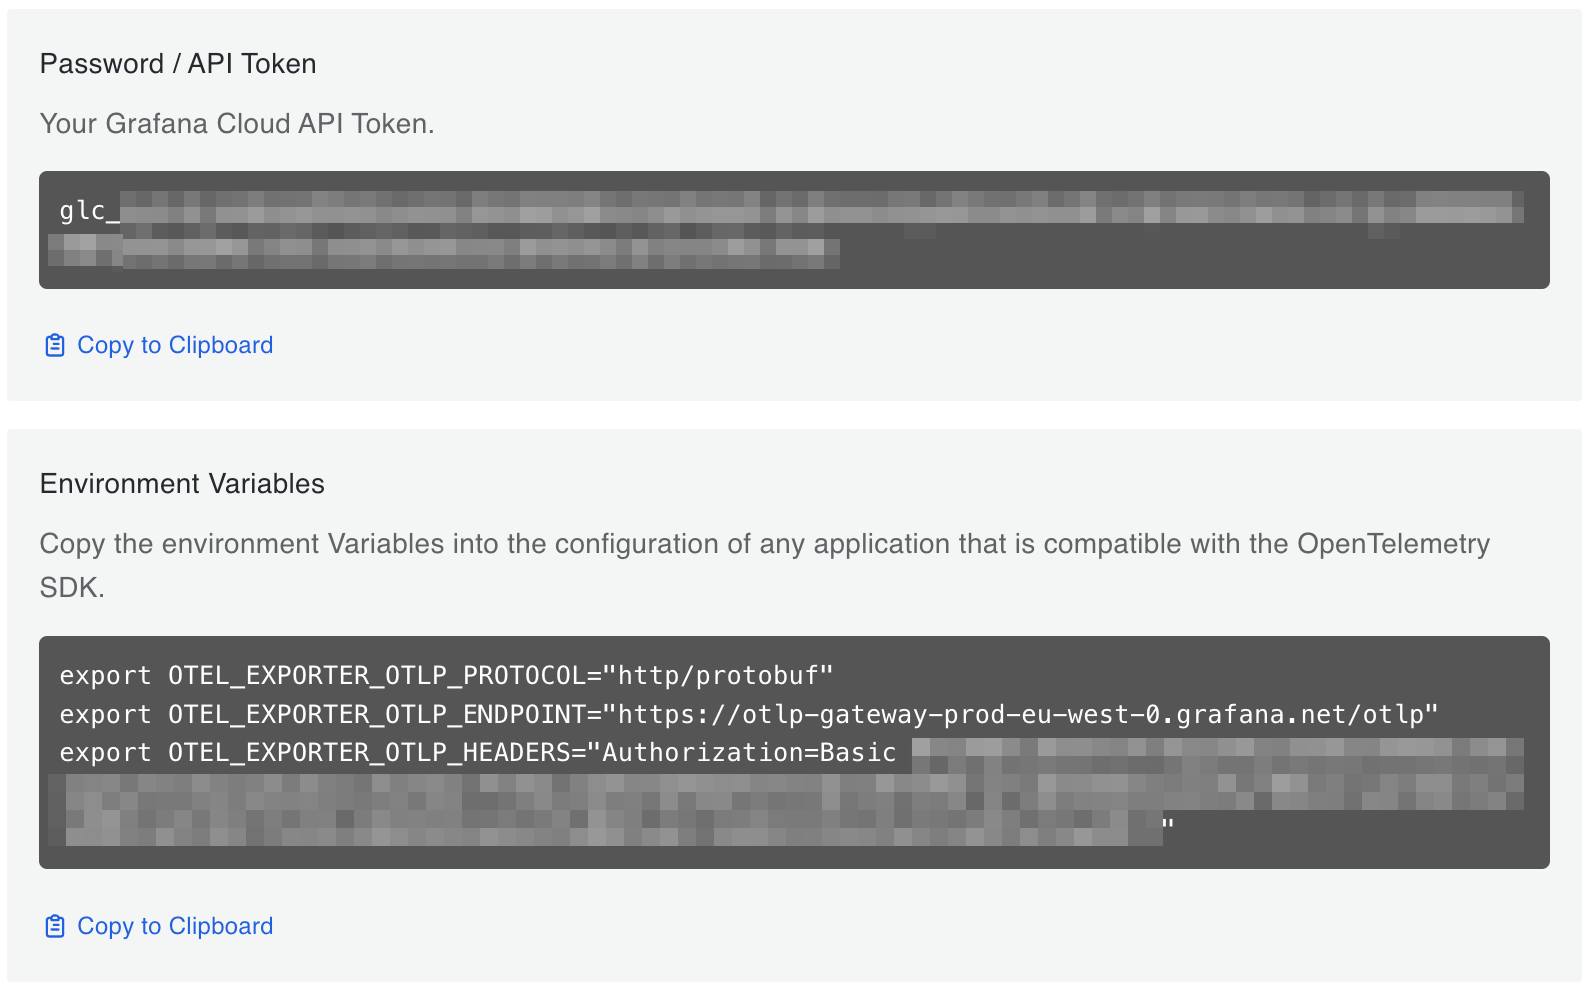
Copy the Environment Variables and keep it for the next step.
4. Run Beyla with minimal configuration
To run Beyla, first set the following environment variables:
- The
OTEL_EXPORTER_OTLP_PROTOCOL,OTEL_EXPORTER_OTLP_ENDPOINTandOTEL_EXPORTER_OTLP_HEADERSvariables copied from the previous step. BEYLA_OPEN_PORT: the port the instrumented service is using (for example,80or443). If using the example service in the first section of this guide, set this variable to8080.
To facilitate local testing, set the BEYLA_TRACE_PRINTER=text environment variable. When this option is set, Beyla prints traces in text format to the standard output.
Notice: Beyla requires elevated privileges. Running with sudo is the simplest approach. For more restrictive environments, Beyla can run with specific Linux capabilities. Refer to Security, permissions and capabilities for details on the required capabilities for your use case.
export BEYLA_OPEN_PORT=8080
export BEYLA_TRACE_PRINTER=text
export OTEL_EXPORTER_OTLP_PROTOCOL="http/protobuf"
export OTEL_EXPORTER_OTLP_ENDPOINT="https://otlp-gateway-prod-eu-west-0.grafana.net/otlp"
export OTEL_EXPORTER_OTLP_HEADERS="Authorization=Basic ...your-encoded-credentials..."
sudo -E beyla
5. Test the service
With Beyla and the service running, make HTTP requests to the instrumented service:
curl http://localhost:8080/fooBeyla should output traces to the standard output similar to this:
2024-01-09 10:31:33.19103133 (3.254486ms[3.254486ms]) 200 GET /foo [127.0.0.1]->[127.0.0.1:8080]
size:80B svc=[{quickstart  rust lima-ubuntu-lts-5074}] traceparent=[00-46214bd23716280eef43cf798dbe5522-0000000000000000-01]
The above trace shows:
2024-01-09 10:31:33.19103133: time of the trace(3.254486ms[3.254486ms]): total response time for the request200 GET /foo: response code, HTTP method, and URL path[127.0.0.1]->[127.0.0.1:8080]source and destinationhost:portsize:80B: size of the HTTP request (sum of the headers and the body)svc=[{quickstart rust lima-ubuntu-lts-5074}]:quickstartservice, written inrust, with an automatically created service instance namelima-ubuntu-lts-5074traceparentas received by the parent request, or a new random one if the parent request didn’t specify it
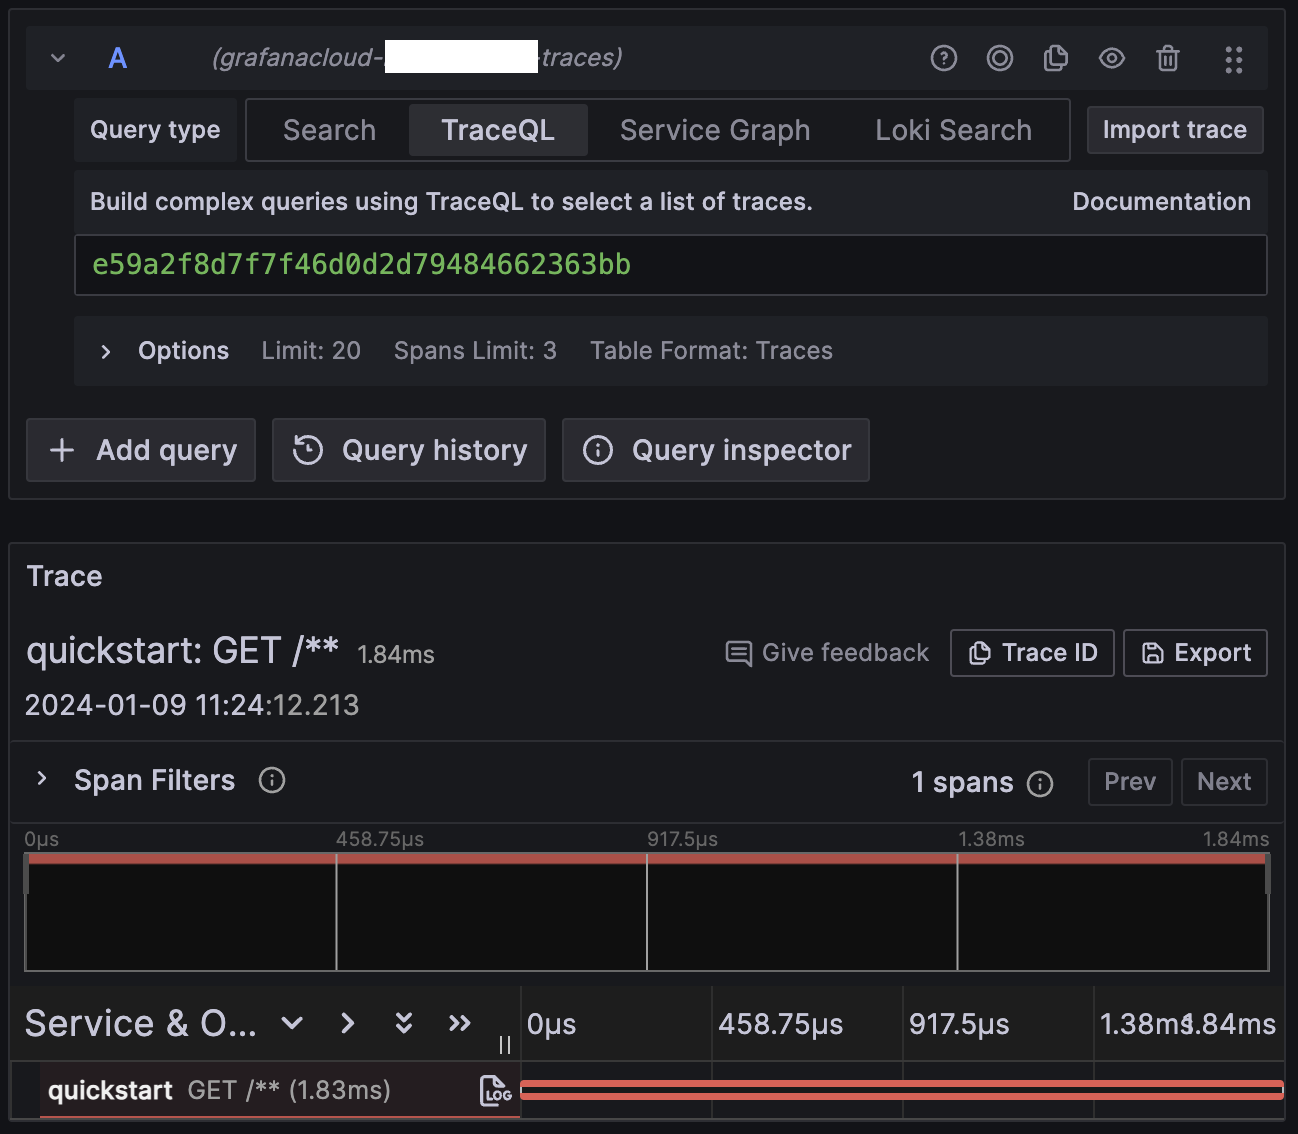
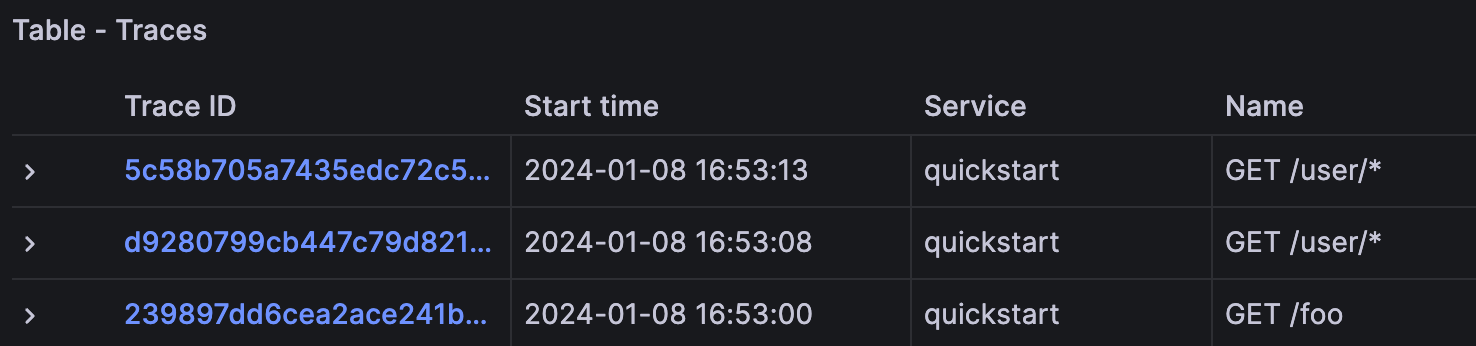
After a few minutes traces will appear in Grafana Cloud. For example, in the traces explorer:
6. Configure routing
The exposed span name in Grafana Cloud is a generic GET /**, where it should say something like GET /foo (the path of the
test request URL).
Beyla groups any unknown URL path as /** to avoid unexpected cardinality explosions.
Configure routing to tell Beyla about expected routes.
For this quickstart, let Beyla to heuristically group the routes.
First, create a config.yml file with the following content:
routes:
  unmatched: heuristic
Then, run Beyla with the -config argument (or use the BEYLA_CONFIG_PATH environment variable instead):
sudo -E beyla -config config.ymlFinally, make HTTP requests:
curl http://localhost:8080/foo
curl http://localhost:8080/user/1234
curl http://localhost:8080/user/5678
Grafana will now heuristically assign a route to each trace. /foo got its own route while /user/1234 and
/user/5678 were grouped into the /user/* route.
Next steps
- Get more details of the different Beyla configuration options.
- Learn how to deploy Beyla as a Docker container or as a Kubernetes DaemonSet or sidecar.