Measuring total request times, instead of service times
Grafana Beyla is an eBPF based application auto-instrumentation tool that is able to track the total request time, for your server side application code.
When performing a remote service request, the perceived client response time is different from the measured response time at the server.
Life cycle of a web service request
The following image illustrates an example life cycle of a web service request. From the start of the service request until the end of the service response, the client-perceived response time is near to 140 ms.
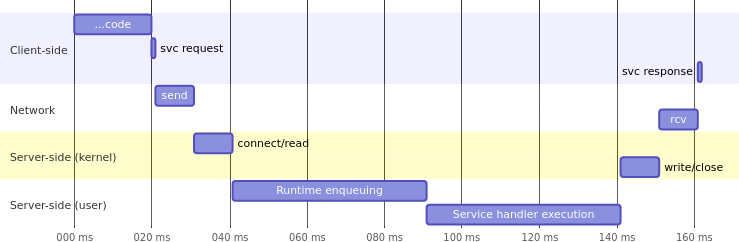
At the server side, most instrumentation agents are only able to insert probes to measure the service handler time, which is the part of the code that is written by the service owner, while the rest of server-side execution time is at the kernel side or at the language runtime (for example, most languages enqueue incoming HTTP requests for later dispatch).
Under low-load conditions, most of the execution time is spent in the service handler, but in high-load scenarios, many requests might spend a non-negligible time in an internal queue, waiting to be dispatched. In the above timeline, instrumenting only the server handler would report metrics measuring that a web request has required 50ms to execute, while in reality it has spent 120ms at the server side. The service owner would get inaccurate metrics about their services’ behavior.
Track total request time
eBPF allows us to overcome the limitations of manual instrumentation tools. Beyla inserts tracepoints at the kernel connect/receive/write/close functions (also at the Go runtime in the case of Go applications). This low level instrumentation provides more accurate metrics and traces, much closer to the user-perceived response time.
Beyla reports traces that are divided in different spans:
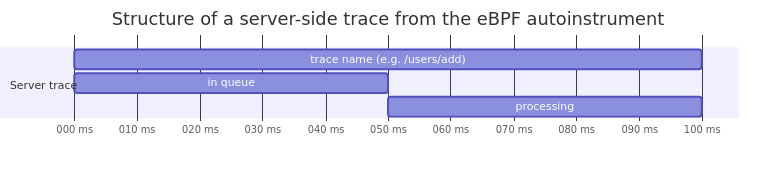
The above image shows the typical structure of a trace as reported by Beyla:
- an overall span measuring the total time spent by the request at the server side
- a child span measuring the time spent by the request in the queue, waiting to be dispatched
- a child span, starting where the previous child span ends, measuring the time being spent by the actual request handler (application logic)