Configure Beyla export modes
Beyla exports data in Alloy or Direct mode.
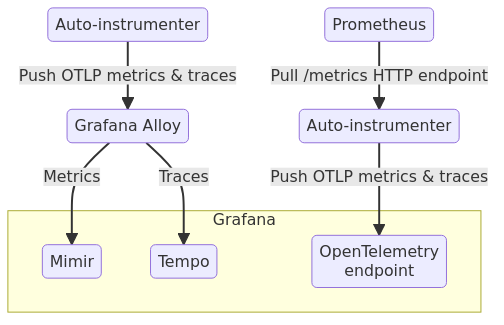
Beyla running in Alloy mode on the left and Direct mode on the right.
Direct mode
In Direct mode Beyla pushes metrics and traces directly to a remote endpoint using the OpenTelemetry protocol (OTLP).
Beyla can also expose a Prometheus HTTP endpoint ready to scrape, for example in pull mode.
To use Direct mode requires configuration with authentication credentials. Set the OTLP endpoint authentication credentials with these environment variables:
OTEL_EXPORTER_OTLP_ENDPOINTOTEL_EXPORTER_OTLP_HEADERS
To run in Direct mode using the Prometheus scrape endpoint, see the configuration documentation.
Alloy mode
In Alloy mode Beyla sends metrics and traces to Grafana Alloy. Alloy processes and sends them to Mimir and Tempo. Alloy manages the authentication required by the Mimir and Tempo endpoints.
This mode integrates with Grafana exclusive features like span-to-metrics and span-to-service graph converters.
The following sections are examples of how to set up Alloy and Beyla to send to Grafana Cloud.
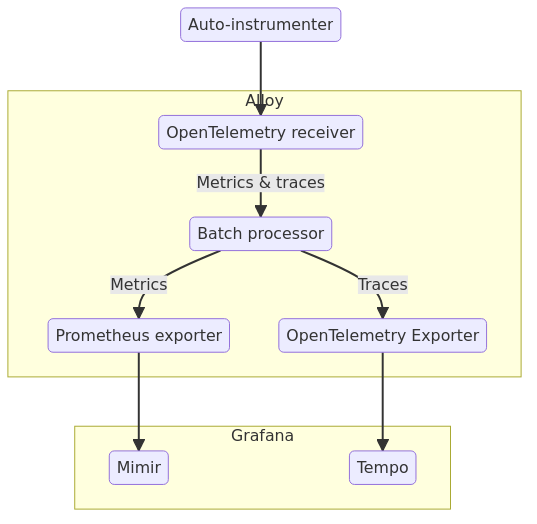
Configure Alloy pipeline
First, install and configure Grafana Alloy. Configure the Alloy pipeline and specify the following nodes:
Download the example River configuration file.
Create an OpenTelemetry receiver endpoint for the auto-instrumentation tool to forward metrics and traces. Add this entry to the Alloy configuration file:
otelcol.receiver.otlp "default" {
  grpc {}
  http {}

  output {
    metrics = [otelcol.processor.batch.default.input]
    traces = [otelcol.processor.batch.default.input]
  }
}
This enables Alloy to receive OpenTelemetry events via GRPC and HTTP. Alloy forwards the data to the batch processor. The batch processor accumulate the data and forwards it to exporters:
otelcol.processor.batch "default" {
  output {
    metrics = [otelcol.exporter.prometheus.default.input]
    traces  = [otelcol.exporter.otlp.tempo.input]
  }
}
Export either metrics, traces, or both. To export a single data type, omit the metrics or traces lines in the node definitions and skip the related exporters.
Alloy exports metrics in Prometheus format to Grafana Mimir. The configuration uses basic authentication. The Alloy configuration uses values set in environment variables:
otelcol.exporter.prometheus "default" {
    forward_to = [prometheus.remote_write.mimir.receiver]
}

prometheus.remote_write "mimir" {
  endpoint {
    url = "https://" + env("MIMIR_ENDPOINT") + "/api/prom/push"
    basic_auth {
      username = env("MIMIR_USER")
      password = env("GRAFANA_API_KEY")
    }
  }
}
Set authentication environment variables and run Alloy:
export MIMIR_USER=734432
export MIMIR_ENDPOINT=prometheus-prod-01-eu-west-0.grafana.net
export GRAFANA_API_KEY=VHJhbGFyw60gcXVlIHRlIHbD....=
Finally, set up a Grafana Tempo exporter and endpoint. The Alloy configuration uses values set in environment variables:
otelcol.exporter.otlp "tempo" {
    client {
        endpoint = env("TEMPO_ENDPOINT")
        auth     = otelcol.auth.basic.creds.handler
    }
}

otelcol.auth.basic "creds" {
    username = env("TEMPO_USER")
    password = env("GRAFANA_API_KEY")
}
Note that the TEMPO_ENDPOINT and TEMPO_USER values are different from MIMIR_ENDPOINT and MIMIR_USER.
Run Alloy with a named configuration file:
grafana-alloy run alloy-config.riverConfigure and run Beyla
This tutorial assumes Beyla and Alloy are running natively on the same host, so there is no need to secure the traffic nor provide authentication in the Alloy OTLP receiver.
Install Grafana Beyla and download the example configuration file.
First, specify the executable to instrument. For a service executable running on port 443, add the open_port property to the YAML document:
discovery:
  instrument:
    - open_ports: 443
Next, specify where the traces and the metrics are sent. If Alloy is running on the local host, it uses port 4318:
otel_metrics_export:
  endpoint: http://localhost:4318
otel_traces_export:
  endpoint: http://localhost:4318
You can specify a combination of otel_metrics_export and otel_traces_export properties to export metrics, traces, or both.
Run Beyla with a named configuration file:
beyla -config instrument-config.ymlor
BEYLA_CONFIG_PATH=instrument-config.yml beyla