Beyla network metrics quickstart
Beyla can generate network metrics in any environment (physical host, virtual host, or container). It’s recommended to use a Kubernetes environment, as Beyla is able to decorate each metric with the metadata of the source and destination Kubernetes entities.
Note
This tutorial describes how to deploy Beyla in Kubernetes from scratch. To use Helm, consult the Deploy Beyla in Kubernetes with Helm documentation.
Deploy Beyla with network metrics
To enable network metrics, set the following option in your Beyla configuration:
network:
  enable: true
Or export the following environment variable
export BEYLA_NETWORK_METRICS=trueNetwork metrics requires metrics to be decorated with Kubernetes metadata. To enable this feature, set the following option in your Beyla configuration:
attributes:
  kubernetes:
    enable : true
Or export the following environment variable
export BEYLA_KUBE_METADATA_ENABLE=trueFinally, network metrics requires elevated privileges. Running with sudo or privileged: true for Kubernetes is the simplest approach. For more restrictive environments, Beyla can run with specific Linux capabilities. Refer to Security, permissions and capabilities for details on the required capabilities for your use case.
To learn more about Beyla configuration, consult the Beyla configuration documentation.
Example configuration
The following YAML configuration provides a simple Beyla deployment for network metrics:
apiVersion: v1
kind: ServiceAccount
metadata:
  name: beyla
---
apiVersion: rbac.authorization.k8s.io/v1
kind: ClusterRole
metadata:
  name: beyla
rules:
  - apiGroups: [ "apps" ]
    resources: [ "replicasets" ]
    verbs: [ "list", "watch" ]
  - apiGroups: [ "" ]
    resources: [ "pods", "services", "nodes" ]
    verbs: [ "list", "watch" ]
---
apiVersion: rbac.authorization.k8s.io/v1
kind: ClusterRoleBinding
metadata:
  name: beyla
subjects:
  - kind: ServiceAccount
    name: beyla
    namespace: default
roleRef:
  apiGroup: rbac.authorization.k8s.io
  kind: ClusterRole
  name: beyla
---
apiVersion: v1
kind: ConfigMap
metadata:
  name: beyla-config
data:
  beyla-config.yml: |
    attributes:
      kubernetes:
        enable: true
    network:
      enable: true
      print_flows: true
---
apiVersion: apps/v1
kind: DaemonSet
metadata:
  name: beyla
spec:
  selector:
    matchLabels:
      instrumentation: beyla
  template:
    metadata:
      labels:
        instrumentation: beyla
    spec:
      serviceAccountName: beyla
      hostNetwork: true
      volumes:
        - name: beyla-config
          configMap:
            name: beyla-config
      containers:
        - name: beyla
          image: grafana/beyla:main
          securityContext:
            privileged: true
          volumeMounts:
            - mountPath: /config
              name: beyla-config
          env:
            - name: BEYLA_CONFIG_PATH
              value: "/config/beyla-config.yml"
Note the following requirements for this deployment configuration:
- The container image uses the latest under-development
grafana/beyla:mainimage. - Beyla needs to run as a DaemonSet, as it is requires only one Beyla instance per node
- To listen to network packets on the host, Beyla requires the
hostNetwork: truepermission - To decorate the network metrics with Kubernetes metadata, create a
ClusterRoleandClusterRoleBindingwithlistandwatchpermissions for ReplicaSets, Pods, Services and Nodes
The configuration does not set an endpoint to export metrics. Instead, the trace_printer: text option outputs the captured network flows to standard output.
Use kubectl logs to see network flow entries, for example:
network_flow: beyla.ip=172.18.0.2 iface= direction=255 src.address=10.244.0.4 dst.address=10.96.0.1
src.name=local-path-provisioner-7577fdbbfb-g6b7d dst.name=kubernetes
k8s.src.node.name=kind-control-plane k8s.dst.namespace=default k8s.dst.name=kubernetes
k8s.dst.owner.type=Service k8s.src.namespace=local-path-storage
k8s.src.name=local-path-provisioner-7577fdbbfb-g6b7d k8s.src.type=Pod
k8s.src.owner.name=local-path-provisioner k8s.src.owner.type=Deployment
k8s.dst.type=Service k8s.dst.owner.name=kubernetes
For further information on the attributes used, consult the network metrics documentation.
Export OpenTelemetry metrics
After you have confirmed that network metrics are being collected, configure Beyla to export the metrics in OpenTelemetry format to an OpenTelemetry endpoint.
Note
Prometheus exporting for network metrics is not currently supported.
Beyla works with any OpenTelemetry endpoint. This quickstart uses the OpenTelemetry endpoint in Grafana Cloud. You can get a Free Grafana Cloud Account at Grafana’s website.
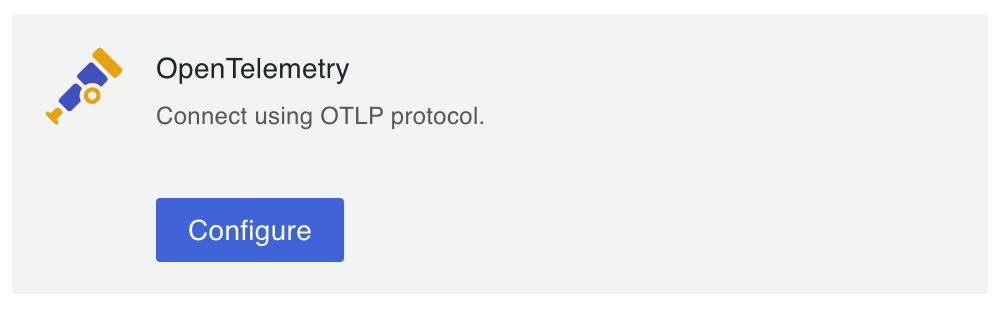
To get your stack’s OpenTelemetry endpoint, login to the Grafana Cloud Portal, and click Configure under the OpenTelemetry section.
Under Password / API token, click Generate now and follow the instructions to create an API token.
The Environment Variables section is populated with a set of standard OpenTelemetry environment variables which provide the connection endpoint and credentials information for Beyla.
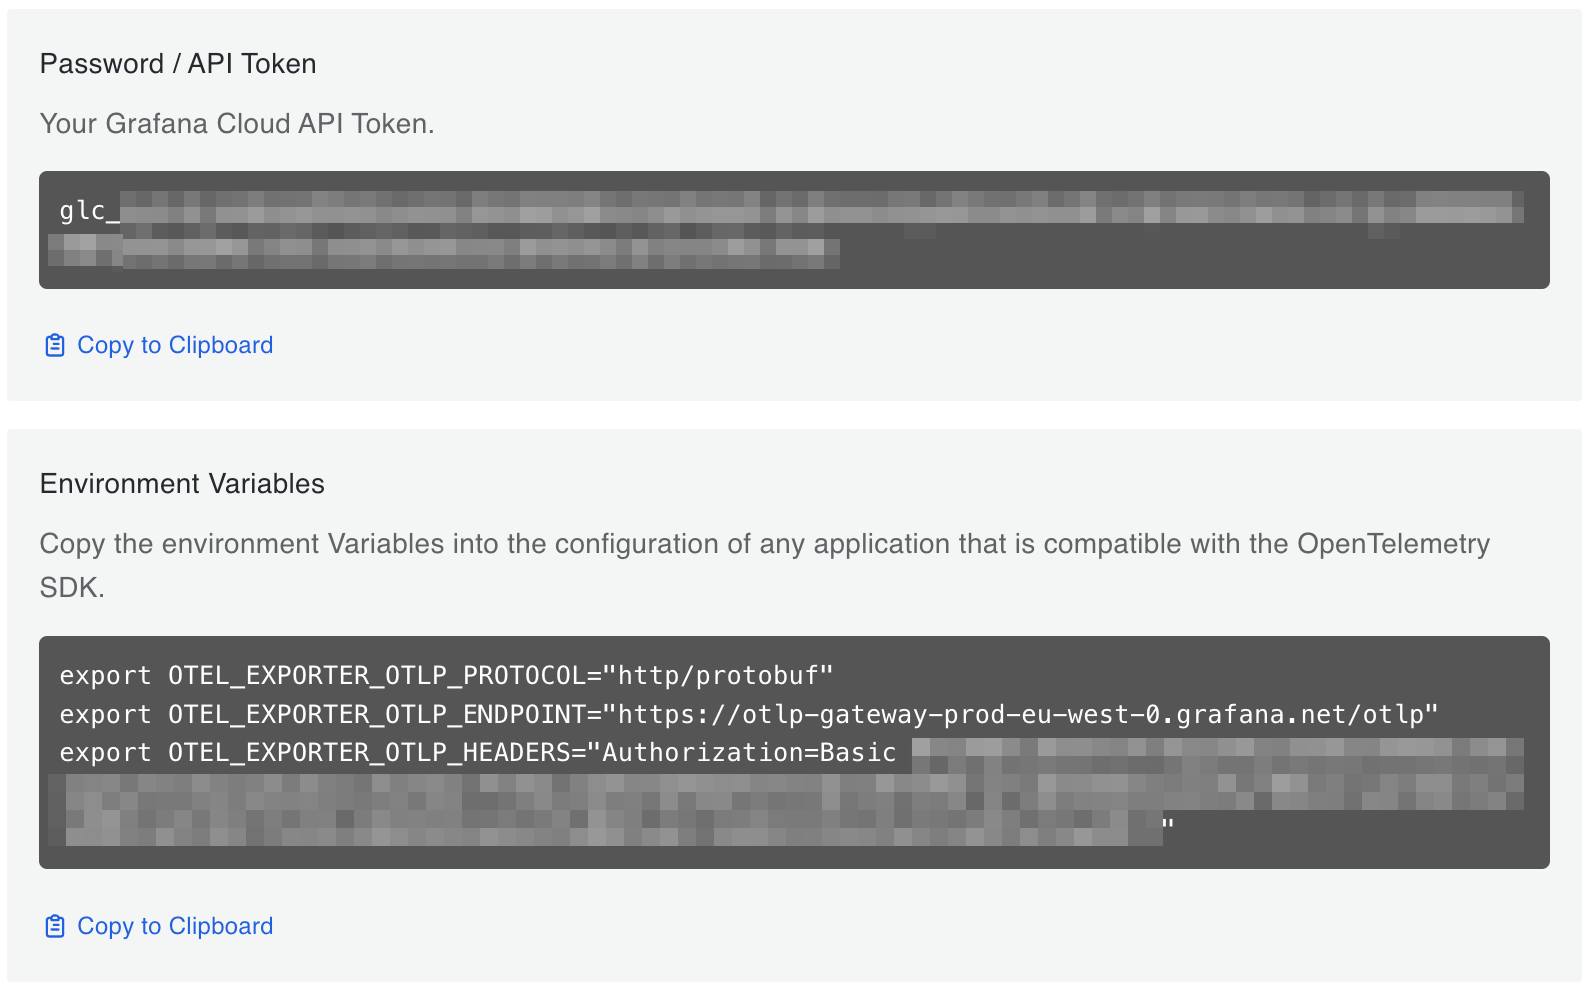
Copy the value of OTEL_EXPORTER_OTLP_HEADERS environment variable and paste it as a Kubernetes secret (and deploy it):
apiVersion: v1
kind: Secret
metadata:
  name: grafana-secret
type: Opaque
stringData:
  otlp-headers: "Authorization=Basic MzQ3NTp....."
Now add the OTEL_EXPORTER_OTLP_HEADERS and reference this secret as the variable value.
Also Add OTEL_EXPORTER_OTLP_ENDPOINT and its value as an environment variable to the Beyla container in the Kubernetes manifest. The env section of the beyla container in the manifest from the start of this document should look like:
          env:
            - name: BEYLA_CONFIG_PATH
              value: "/config/beyla-config.yml"
            - name: OTEL_EXPORTER_OTLP_ENDPOINT
              value: "https://otlp-gateway-prod-eu-west-0.grafana.net/otlp"
            - name: OTEL_EXPORTER_OTLP_HEADERS
              valueFrom:
                secretKeyRef:
                  key: otlp-headers
                  name: grafana-secret
Select metrics attributes to reduce cardinality
Be default, Beyla includes the following attributes in the beyla.network.flow.bytes metric:
k8s.src.owner.namek8s.src.namespacek8s.dst.owner.namek8s.dst.namespacek8s.cluster.name
Beyla only includes a subset of the available attributes to avoid leading to
a cardinality explosion in
the metrics storage, especially if some attributes like src.address or dst.address capture the IP addresses of the external traffic.
The attributes.select.<metric-name>.include YAML subsection makes it possible to select the attributes to report:
network:
  enable: true
attributes:
  kubernetes:
    enable: true
  select:
    beyla.network.flow.bytes:
      include:
      - k8s.src.owner.name
      - k8s.src.namespace
      - k8s.dst.owner.name
      - k8s.dst.namespace
The previous example would aggregate the beyla.network.flow.bytes value by source and destination Kubernetes owner
(Deployment, DaemonSet, StatefulSet, ReplicaSet), avoiding finer-grained attributes such as Pod name or IP addresses.
Group IP addresses by CIDR
Reporting metric attributes containing IP addresses (src.address and dst.address) might lead to cardinality explosion,
however it might be a useful network-level information to get a better view about how networks and sub-networks communicate.
The cidrs YAML subsection in network (or the BEYLA_NETWORK_CIDRS environment variable) accepts a list of
subnets in CIDR notation, in both IPv4 and IPv6 format.
The existence of the cidrs section leaves the src.address and dst.address fields untouched,
and adds the src.cidr and dst.cidr attributes. Don’t forget to add them to the attributes.select
section:
network:
  enable: true
  cidrs:
    - 10.10.0.0/24
    - 10.0.0.0/8
    - 10.30.0.0/16
attributes:
  kubernetes:
    enable: true
  select:
    beyla_network_flow_bytes:
      include:
          - k8s.src.owner.name
          - k8s.src.namespace
          - k8s.dst.owner.name
          - k8s.dst.namespace
          - src.cidr
          - dst.cidr