Important: This documentation is about an older version. It's relevant only to the release noted, many of the features and functions have been updated or replaced. Please view the current version.
Metrics from traces
Tempo can generate metrics from ingested traces using the metrics-generator, an optional Tempo component. The metrics-generator runs two different processors: service graphs and span metrics.
Metrics generated by Tempo’s metrics-generator can provide both RED (Rate/Error/Duration) metrics and interdependency graphs between services in a trace (the Service Graph functionality in Grafana). These capabilities rely on a set of generated span metrics and service metrics.
RED metrics represent:
- Rate, the number of requests per second
- Errors, the number of those requests that are failing
- Duration, the amount of time those requests take
For more information about RED method, refer to The RED Method: How to instrument your services.
Use-cases for span metrics
The metrics-generator processes spans and writes metrics to a Prometheus data source using the Prometheus remote write protocol.
Span metrics are of particular interest if your system is not monitored with metrics but it has distributed tracing implemented. You get out-of-the-box metrics from your tracing pipeline.
Note
Metrics generation is disabled by default. Contact Grafana Support to enable metrics generation in your organization.
After the metrics generator is enabled in your organization, refer to Metrics-generator configuration for information about metrics-generator options.
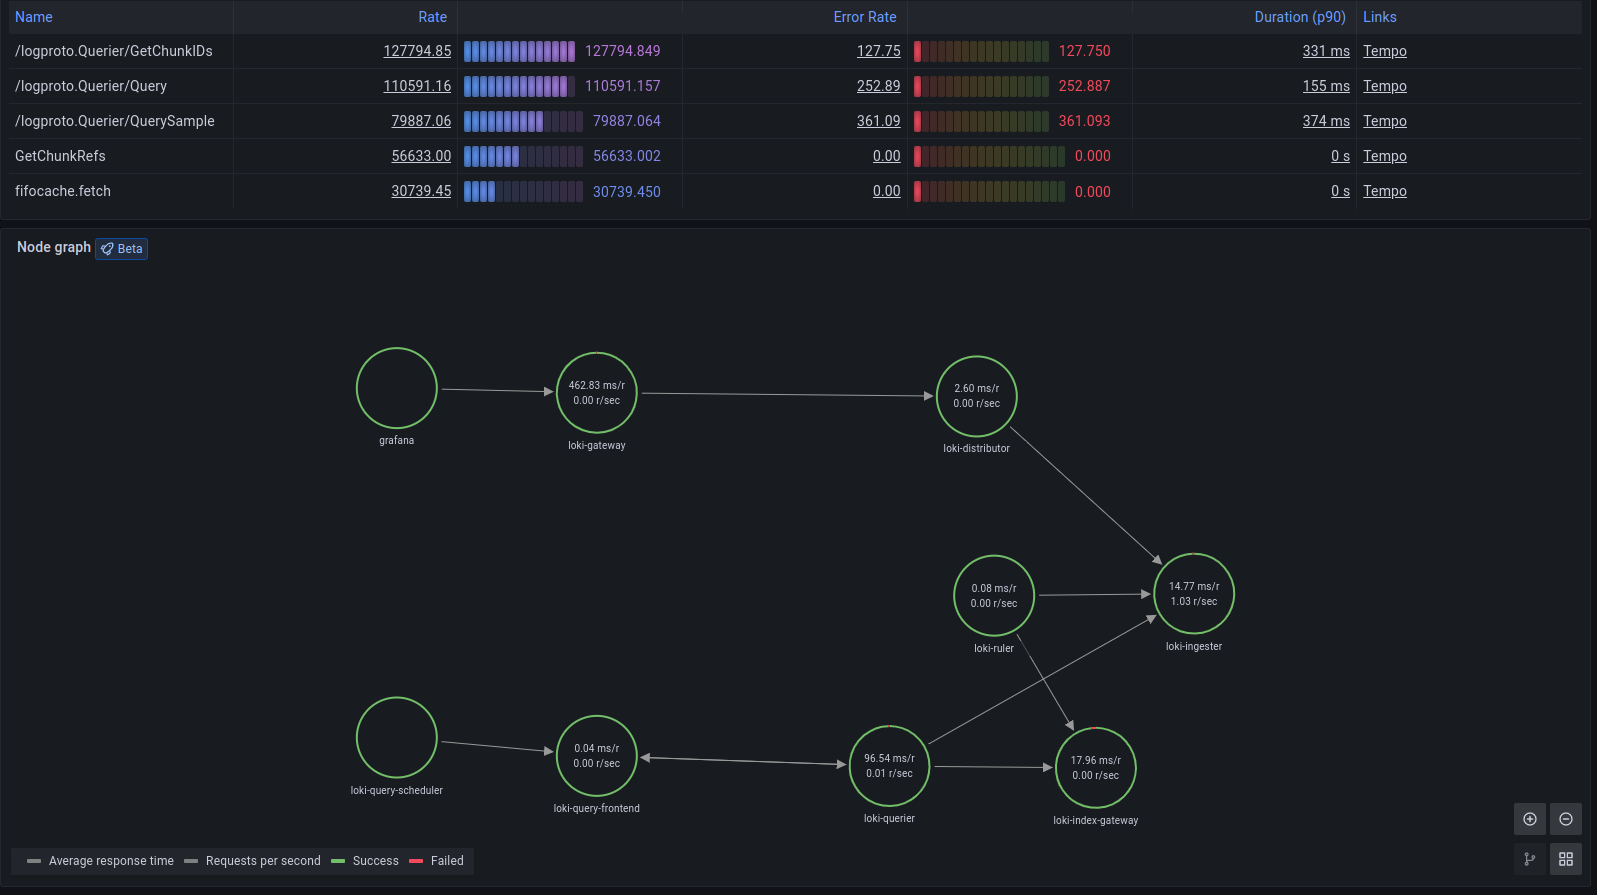
These metrics exist in your Hosted Metrics instance and can also be easily used to generate powerful custom dashboards.
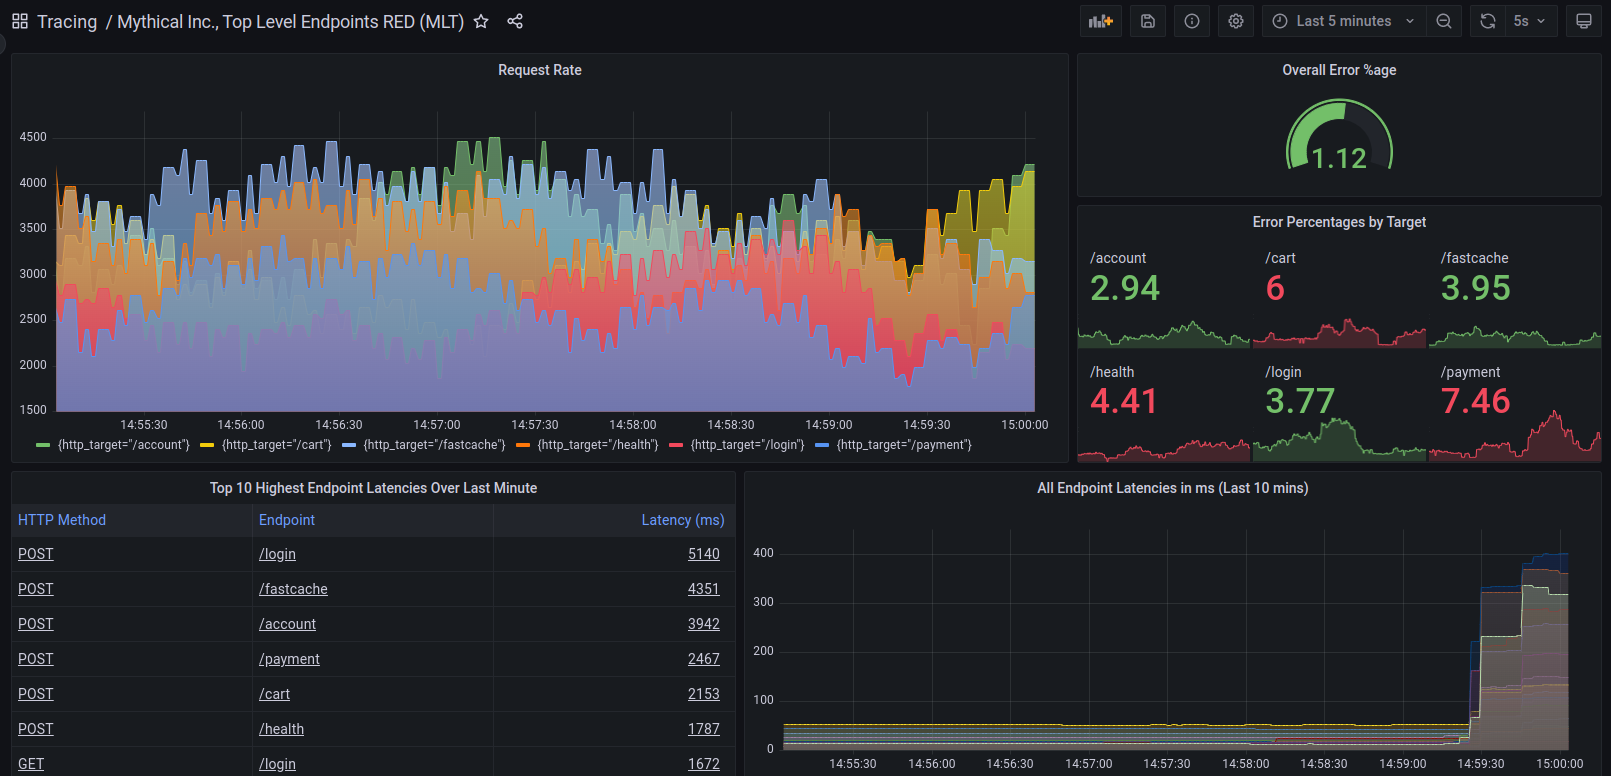
The metrics generator automatically generates exemplars as well which allows easy metrics to trace linking. Exemplars are available in Grafana Cloud so you can also push your own.
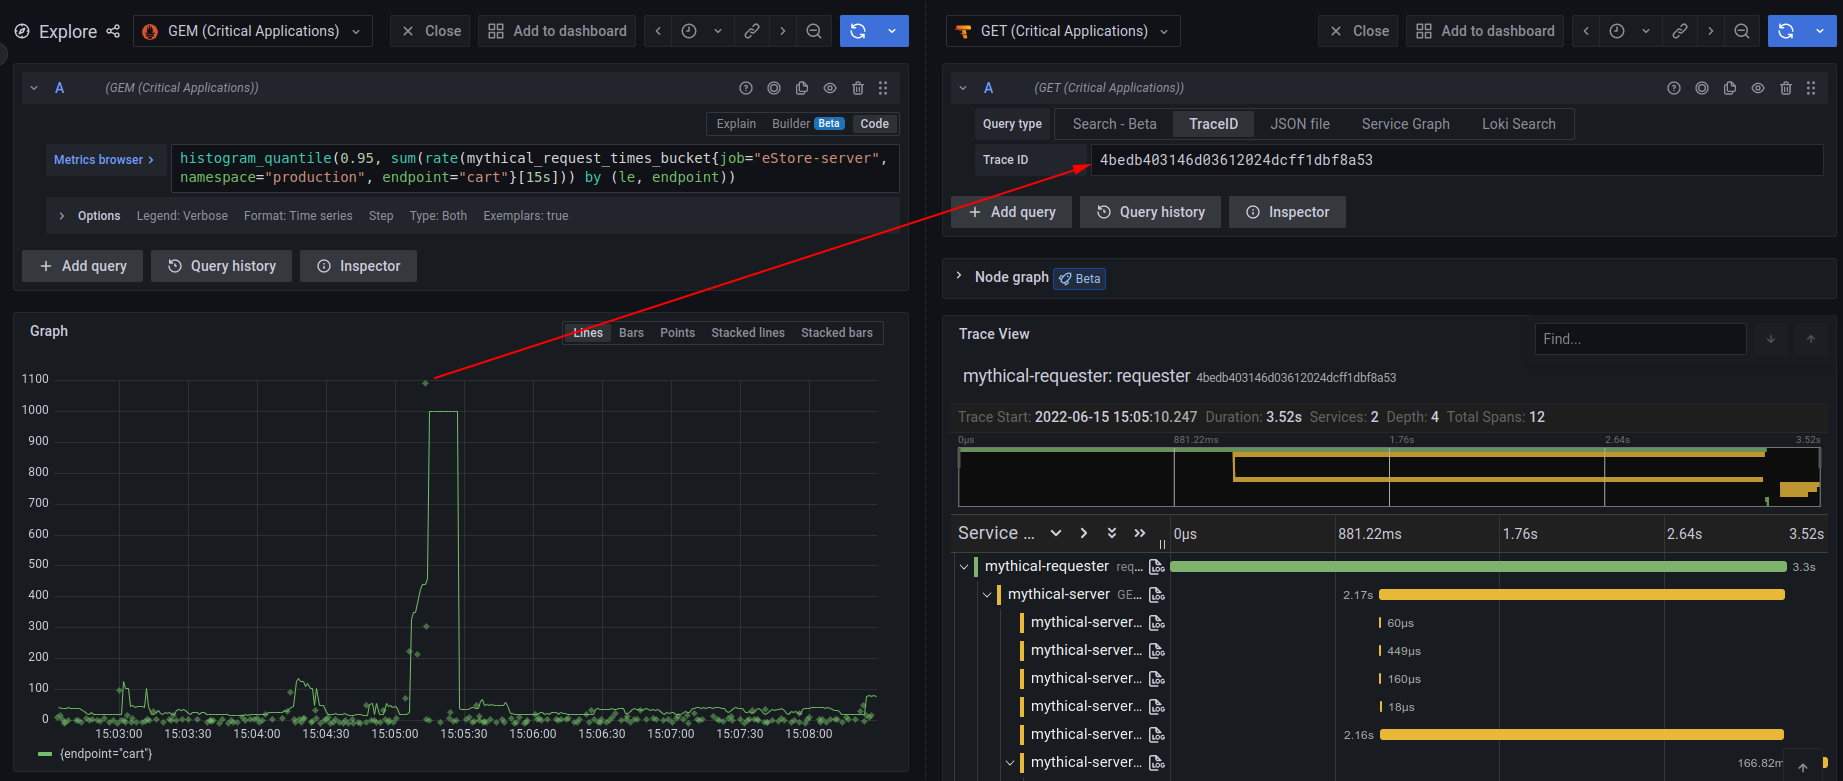
Linking traces and metrics
Grafana can correlate different signals by adding the functionality to link between traces and metrics. The trace to metrics feature, a beta feature in Grafana 9.1, lets you quickly see trends or aggregated data related to each span.
You can try it out by enabling the traceToMetrics feature toggle in your Grafana configuration file.
Refer to the instructions for enabling Grafana feature toggles.
For example, you can use span attributes to metric labels by using the $__tags keyword to convert span attributes to metrics labels.
For more information, refer to the trace to metric configuration documentation.


