Pyroscope and profiling in Grafana
Grafana Pyroscope can be used alongside other Grafana products such as Loki, Tempo, Mimir, and k6. You can use Pyroscope to get the most granular insight into your application and how you can use it to fix issues that you may have identified using metrics, logs, traces, or anything else.
Within Grafana and Grafana Cloud, you can use the Pyroscope data source to query and visualize profile data from within Grafana.
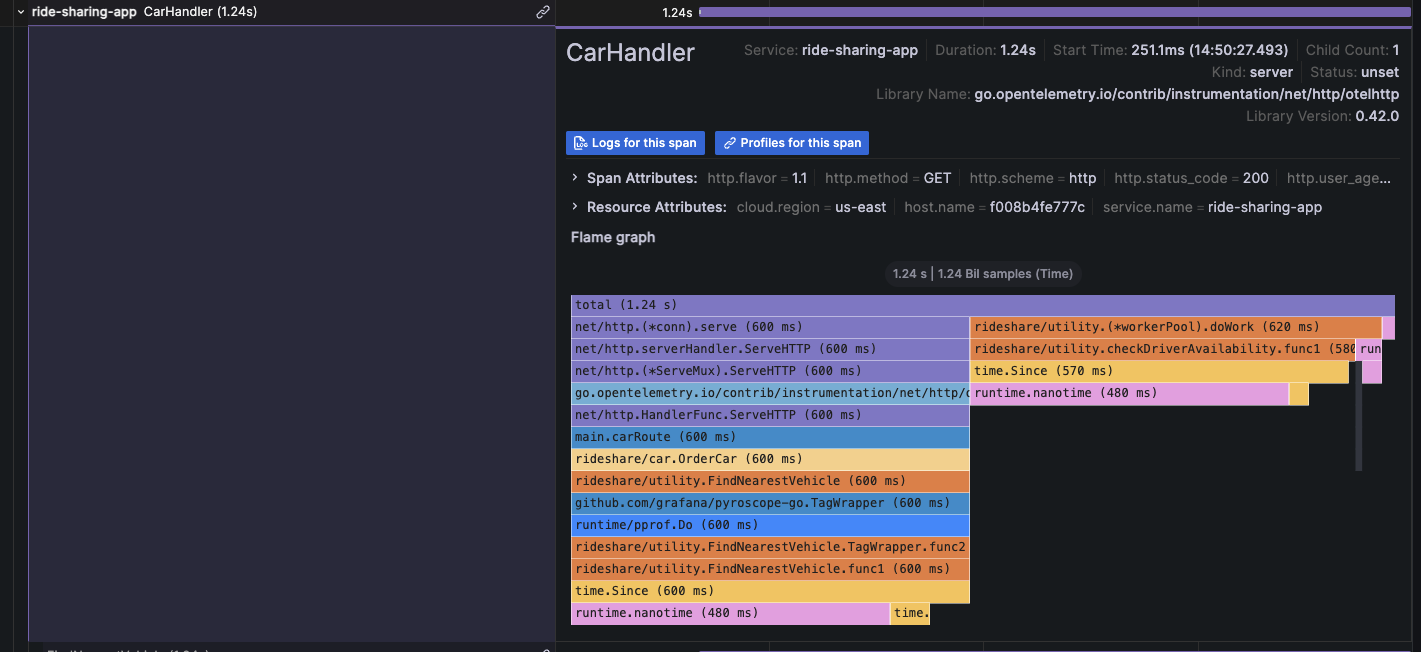
Visualize traces and profiles data
Here is a screenshot of the Explore page that combines traces and profiles to be able to see granular line-level detail when available for a trace span. This lets you see the exact function that’s causing a bottleneck in your application as well as a specific request.
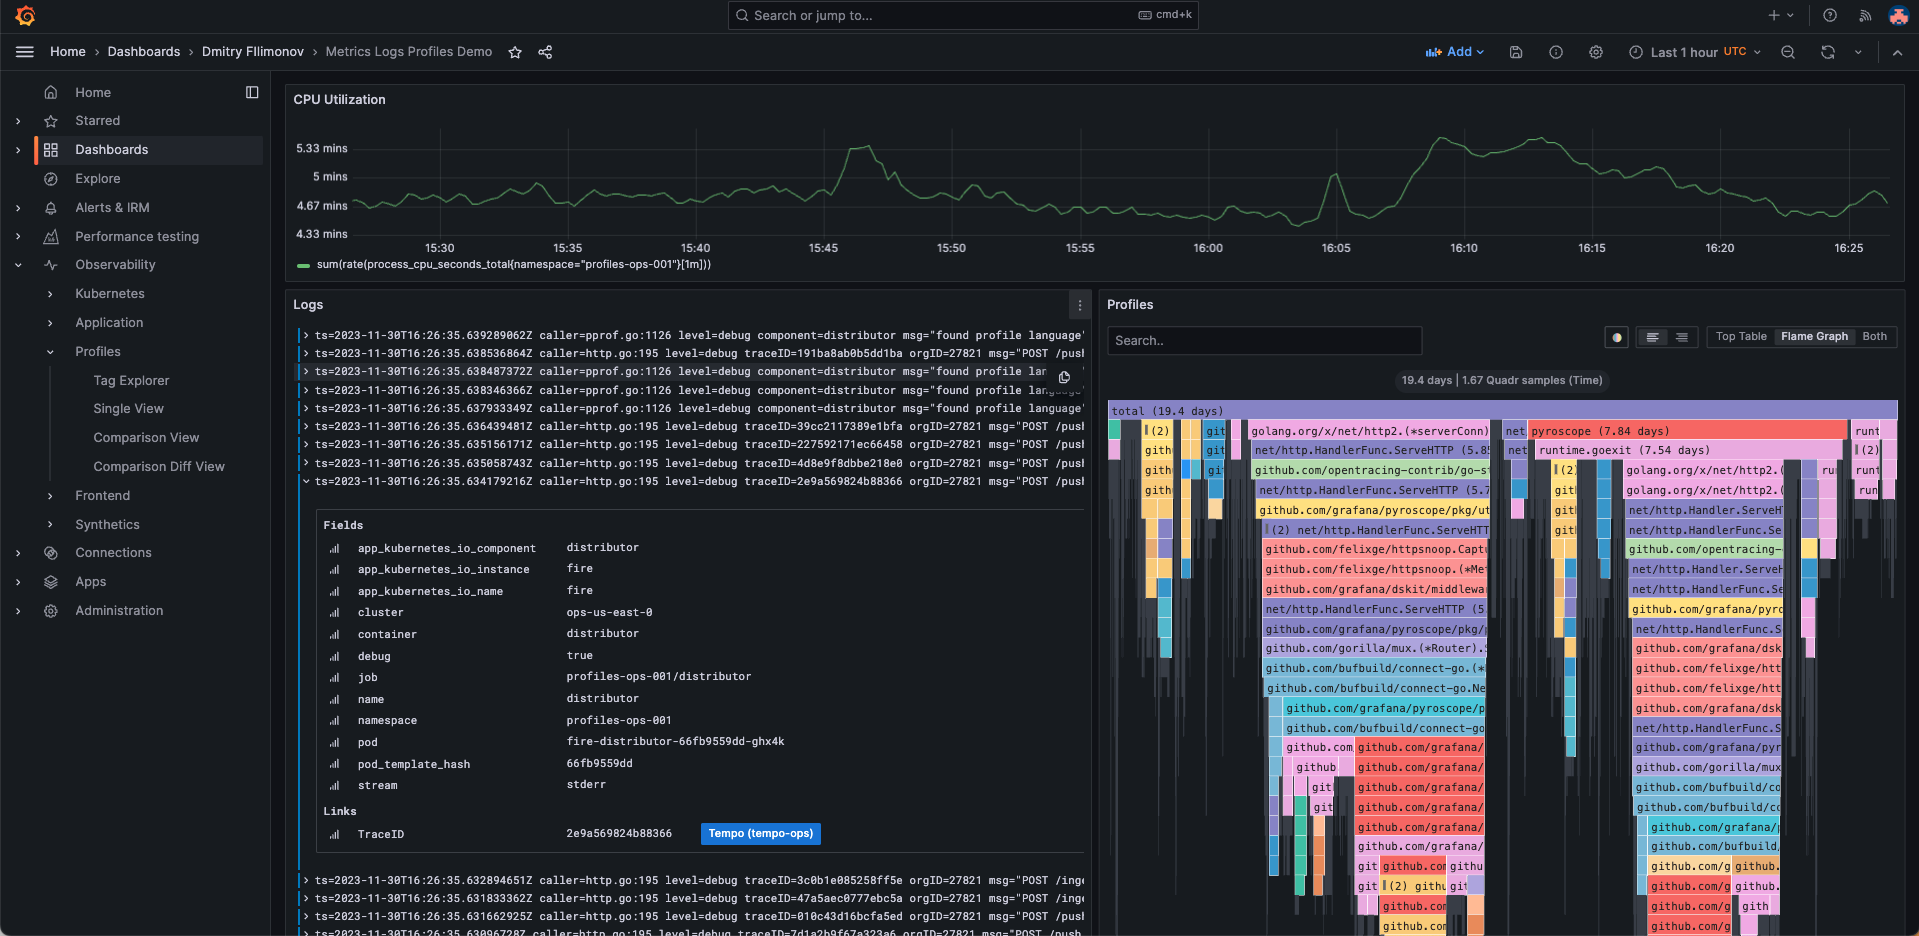
Integrate profiles into dashboards
Here is an example of how you can integrate profiles into your dashboards. In this case, the screenshot shows memory profiles alongside panels for logs and metrics to be able to debug OOM errors alongside the associated logs and metrics.