Span profiles with Traces to profiles for Go
Span Profiles represent a major shift in profiling methodology, enabling deeper analysis of both tracing and profiling data. Traditional continuous profiling provides an application-wide view over fixed intervals. In contrast, Span Profiles delivers focused, dynamic analysis on specific execution scopes within applications, such as individual requests or specific trace spans.
This shift enables a more granular view of performance, enhancing the utility of profiles by linking them directly with traces for a comprehensive understanding of application behavior. As a result, engineering teams can more efficiently identify and address performance bottlenecks.
To learn more about Span Profiles, refer to Combining tracing and profiling for enhanced observability: Introducing Span Profiles.
Pyroscope can integrate with distributed tracing systems supporting the OpenTelemetry standard. This integration lets you link traces with the profiling data and find resource usage for specific lines of code for your trace spans.
Note
- Only CPU profiling is supported.
- Because of how sampling profilers work, spans shorter than the sample interval may not be captured. Go CPU profiler probes stack traces 100 times per second, meaning that spans shorter than 10ms may not be captured.
To use Span Profiles, you need to:
- Configure Pyroscope to send profiling data
- Configure a client-side package to link traces and profiles: Go
- Configure the Tempo data source in Grafana or Grafana Cloud to discover linked traces and profiles
Before you begin
Your applications must be instrumented for profiling and tracing before you can use span profiles.
- Profiling: Your application must be instrumented with Pyroscope’s Go SDK. If you haven’t done this yet, please refer to the Go (push mode) guide.
- Tracing: Your application must be instrumented with OpenTelemetry traces. If you haven’t done this yet, please refer to the OpenTelemetry guide.
Configure the otel-profiling-go package
To start collecting Span Profiles for your Go application, you need to include the otel-profiling-go package in your code.
This package is a TracerProvider implementation that labels profiling data with span IDs. This makes it possible to query for span-specific profiling data with a Tempo data source configured in Grafana or Grafana Cloud.
# Make sure you also upgrade pyroscope server to version 0.14.0 or higher.
go get github.com/grafana/otel-profiling-go
Next, you need to create and configure the tracer provider:
package main

import (
	otelpyroscope "github.com/grafana/otel-profiling-go"
	"github.com/grafana/pyroscope-go"
)

func main() {
	// Initialize your tracer provider as usual.
	tp := initTracer()

	// Wrap it with otelpyroscope tracer provider.
	otel.SetTracerProvider(otelpyroscope.NewTracerProvider(tp))

	// If you're using Pyroscope Go SDK, initialize pyroscope profiler.
	_, _ = pyroscope.Start(pyroscope.Config{
		ApplicationName: "my-service",
		ServerAddress:   "http://localhost:4040",
	})

	// Your code goes here.
}
Now that you set up the tracer, you can create a new trace from anywhere and the profiler automatically captures profiles for it.
ctx, span := otel.Tracer("tracerName").Start(ctx, "ExampleSpan")
defer span.End()
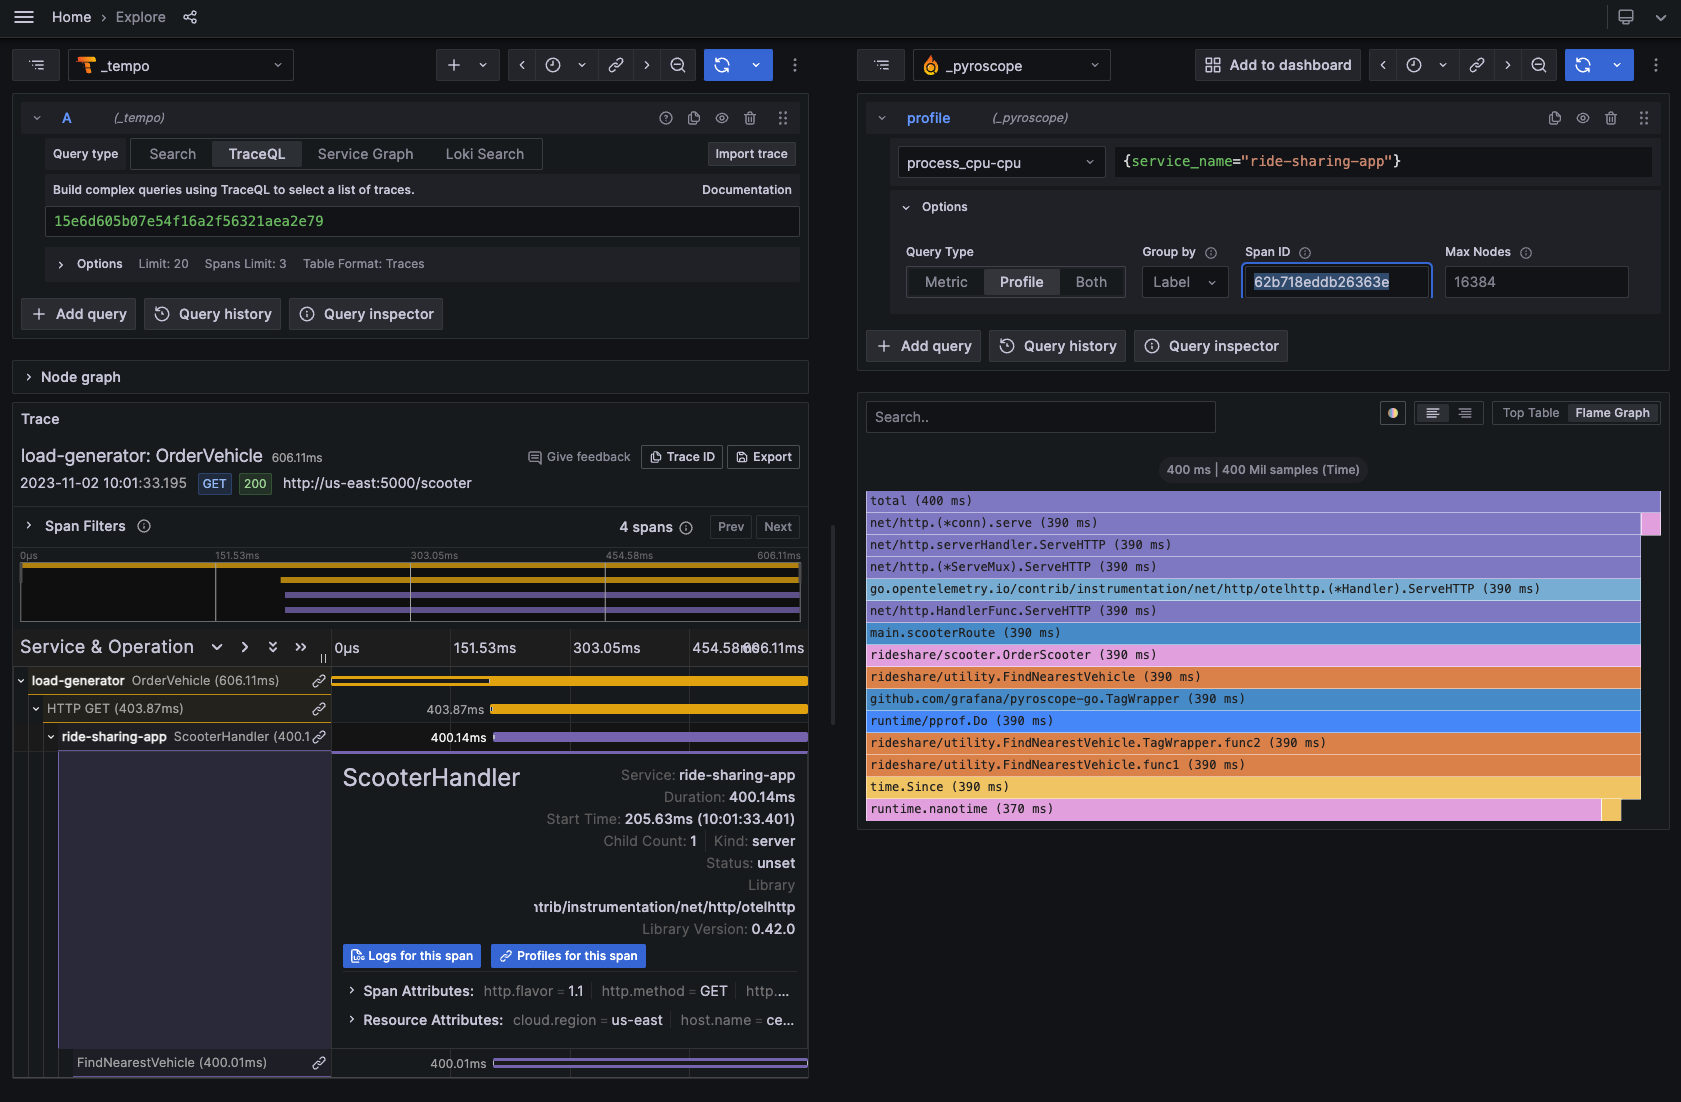
// Your code goes here.View the span profiles in Grafana or Grafana Cloud
To view the span profiles in Grafana Tempo, you need to have a Grafana instance with a Tempo data source configured to link trace spans and profiles. Refer to the configuration documentation for Grafana or Grafana Cloud.
To learn how to set up Traces to profiles and view the span profiles, refer to Traces to profiles.
Examples
Check out the examples directory for a complete demo application that shows tracing integration features.

