Span profiles with Traces to profiles for .NET
Span Profiles represent a shift in profiling methodology. Traditional continuous profiling provides an application-wide view over fixed intervals. In contrast, Span Profiles delivers focused, dynamic analysis on specific execution scopes within applications, such as individual requests or specific trace spans.
To learn more about Span Profiles, refer to Combining tracing and profiling for enhanced observability: Introducing Span Profiles.
Supported profile types
Pyroscope integrates with distributed tracing systems supporting the OpenTelemetry standard. This integration lets you link traces with the profiling data and find resource usage for specific lines of code for your trace spans.
Note
- Only CPU profiling is supported at the moment.
- Because of how sampling profilers work, spans shorter than the sample interval may not be captured.
For a more detailed list of supported profile types, refer to Profile types.
Before you begin
To use Span Profiles, you need to:
- Configure Pyroscope to send profiling data
- Configure a client-side package to link traces and profiles: .NET
- Configure the Tempo data source in Grafana or Grafana Cloud to discover linked traces and profiles
Instrument your application for profiles
Your applications must be instrumented for profiling and tracing before you can use span profiles.
- Profiling: Your application must be instrumented with Pyroscope’s .NET instrumentation library. Refer to the .NET guide for instructions.
- Tracing: Your application must be instrumented with OpenTelemetry traces. Refer to the OpenTelemetry guide for instructions.
Note
Span profiles in .NET are only supported using OpenTelemetry manual instrumentation because Pyroscope’s .NET profiler and OpenTelemetry’s auto instrumentation are based on separate .NET CLR profilers.
Configure the Pyroscope.OpenTelemetry package
To start collecting Span Profiles for your .NET application, you need to include Pyroscope.OpenTelemetry in your code.
This package provides a SpanProcessor implementation, which connects the two telemetry signals (traces and profiles) together.
dotnet add package Pyroscope.OpenTelemetryNext, create and register the PyroscopeSpanProcessor:
builder.Services.AddOpenTelemetry()
    .WithTracing(b =>
    {
        b
        .AddAspNetCoreInstrumentation()
        .AddConsoleExporter()
        .AddOtlpExporter()
        .AddProcessor(new Pyroscope.OpenTelemetry.PyroscopeSpanProcessor());
    });
With the span processor registered, spans created automatically (for example, HTTP handlers) and manually (ActivitySource.StartActivity()) have profiling data associated with them.
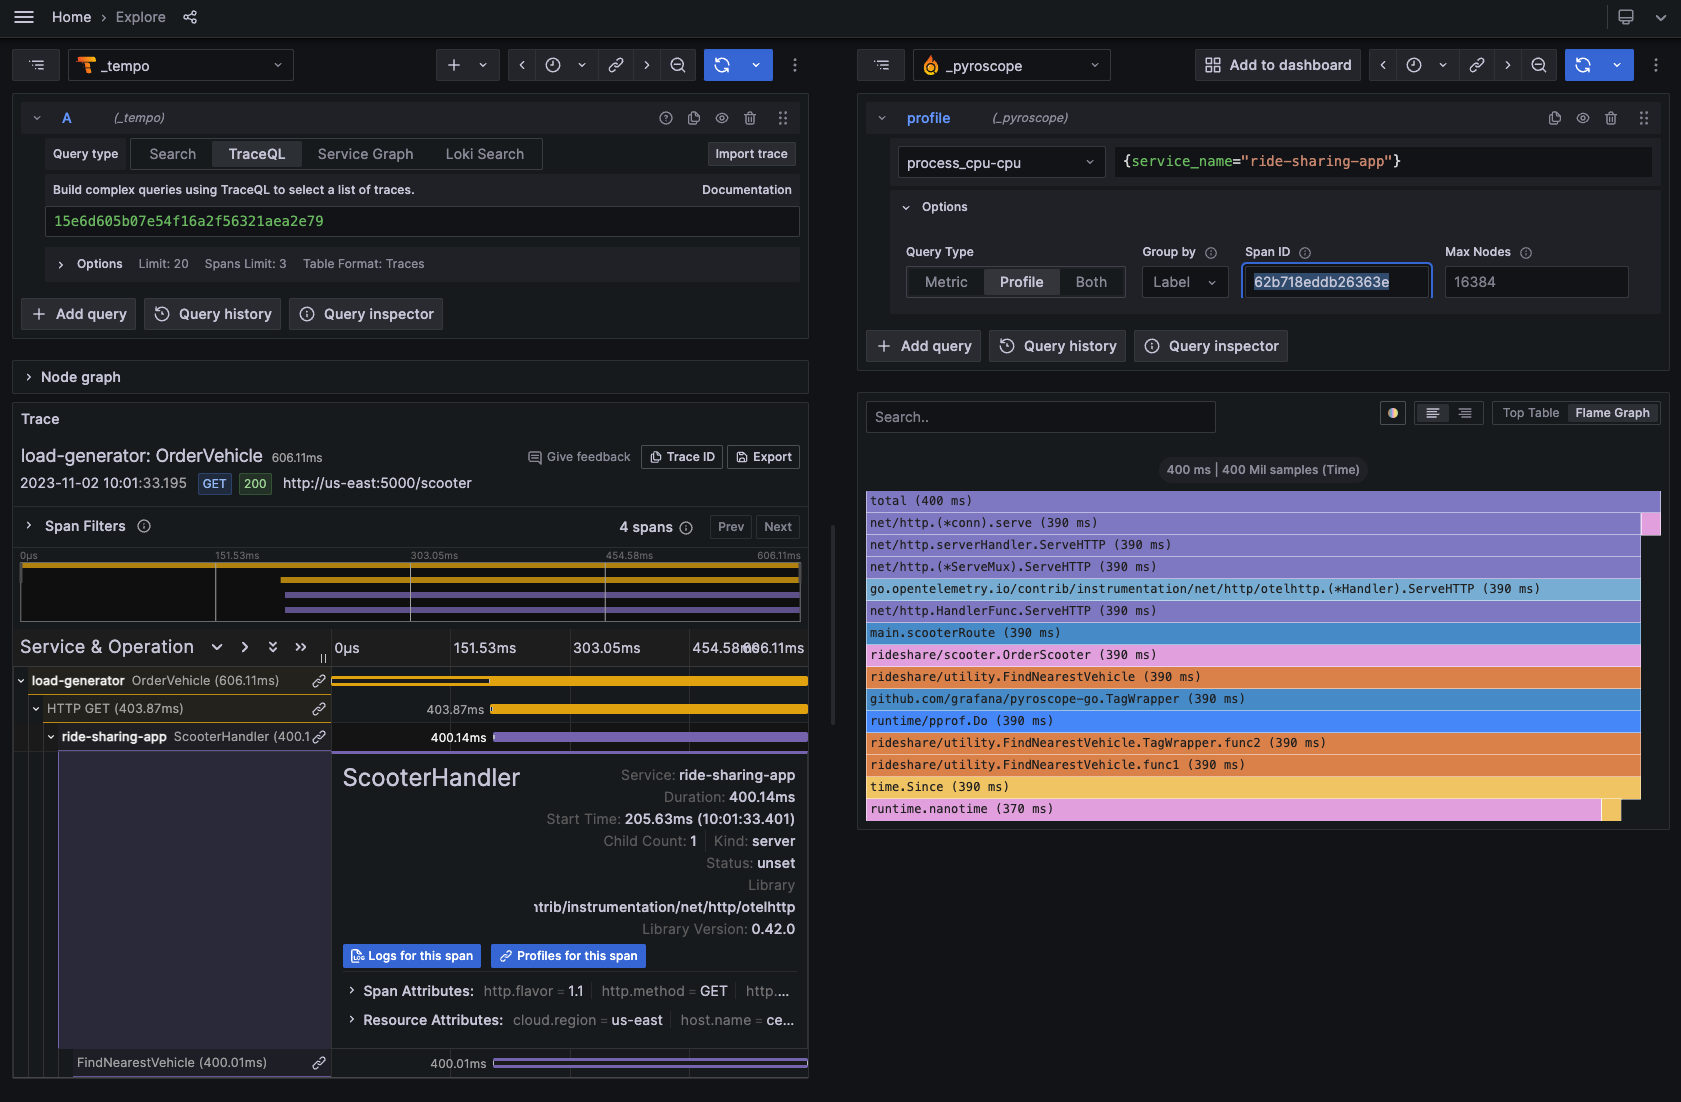
View the span profiles in Grafana
To view the span profiles in Grafana Explore or Grafana Traces Drilldown, you need to have a Grafana instance running and a Tempo data source configured to link traces and profiles.
Refer to the Tempo data source configuration documentation to see how to configure the visualization to link traces with profiles.
Examples
Check out these demo applications for span profiles:
- .NET example
- Other examples in multiple languages

