Important: This documentation is about an older version. It's relevant only to the release noted, many of the features and functions have been updated or replaced. Please view the current version.
Grafana Mimir query sharding
Mimir includes the ability to run a single query across multiple machines. This is achieved by breaking the dataset into smaller pieces. These smaller pieces are called shards. Each shard then gets queried in a partial query, and those partial queries are distributed by the query-frontend to run on different queriers in parallel. The results of those partial queries are aggregated by the query-frontend to return the full query result.
Query sharding at glance
Not all queries are shardable. While the full query is not shardable, the inner parts of a query could still be shardable.
In particular associative aggregations (like sum, min, max, count,
avg) are shardable, while some query functions (like absent, absent_over_time,
histogram_quantile, sort_desc, sort) are not.
In the following examples we look at a concrete example with a shard count of
3. All the partial queries that include a label selector __query_shard__
are executed in parallel. The concat() annotation is used to show when partial
query results are concatenated/merged by the query-frontend.
Example 1: Full query is shardable
sum(rate(metric[1m]))Is executed as (assuming a shard count of 3):
sum(
  concat(
    sum(rate(metric{__query_shard__="1_of_3"}[1m]))
    sum(rate(metric{__query_shard__="2_of_3"}[1m]))
    sum(rate(metric{__query_shard__="3_of_3"}[1m]))
  )
)
Example 2: Inner part is shardable
histogram_quantile(0.99, sum by(le) (rate(metric[1m])))Is executed as (assuming a shard count of 3):
histogram_quantile(0.99, sum by(le) (
  concat(
    sum by(le) (rate(metric{__query_shard__="1_of_3"}[1m]))
    sum by(le) (rate(metric{__query_shard__="2_of_3"}[1m]))
    sum by(le) (rate(metric{__query_shard__="3_of_3"}[1m]))
  )
))
Example 3: Query with two shardable portions
sum(rate(failed[1m])) / sum(rate(total[1m]))Is executed as (assuming a shard count of 3):
sum(
  concat(
    sum (rate(failed{__query_shard__="1_of_3"}[1m]))
    sum (rate(failed{__query_shard__="2_of_3"}[1m]))
    sum (rate(failed{__query_shard__="3_of_3"}[1m]))
  )
)
/
sum(
  concat(
    sum (rate(total{__query_shard__="1_of_3"}[1m]))
    sum (rate(total{__query_shard__="2_of_3"}[1m]))
    sum (rate(total{__query_shard__="3_of_3"}[1m]))
  )
)
How to enable query sharding
In order to enable query sharding you need to opt-in by setting
-query-frontend.parallelize-shardable-queries to true.
Each shardable portion of a query is split into
-query-frontend.query-sharding-total-shards partial queries. If a query has multiple
inner portions that can be sharded, each portion is sharded
-query-frontend.query-sharding-total-shards times. In some cases, this could lead to
an explosion of queries. For this reason, there is a parameter that allows to
modify the default hard limit of 128 queries on the total number of partial
queries a single input query can generate:
-query-frontend.query-sharding-max-sharded-queries.
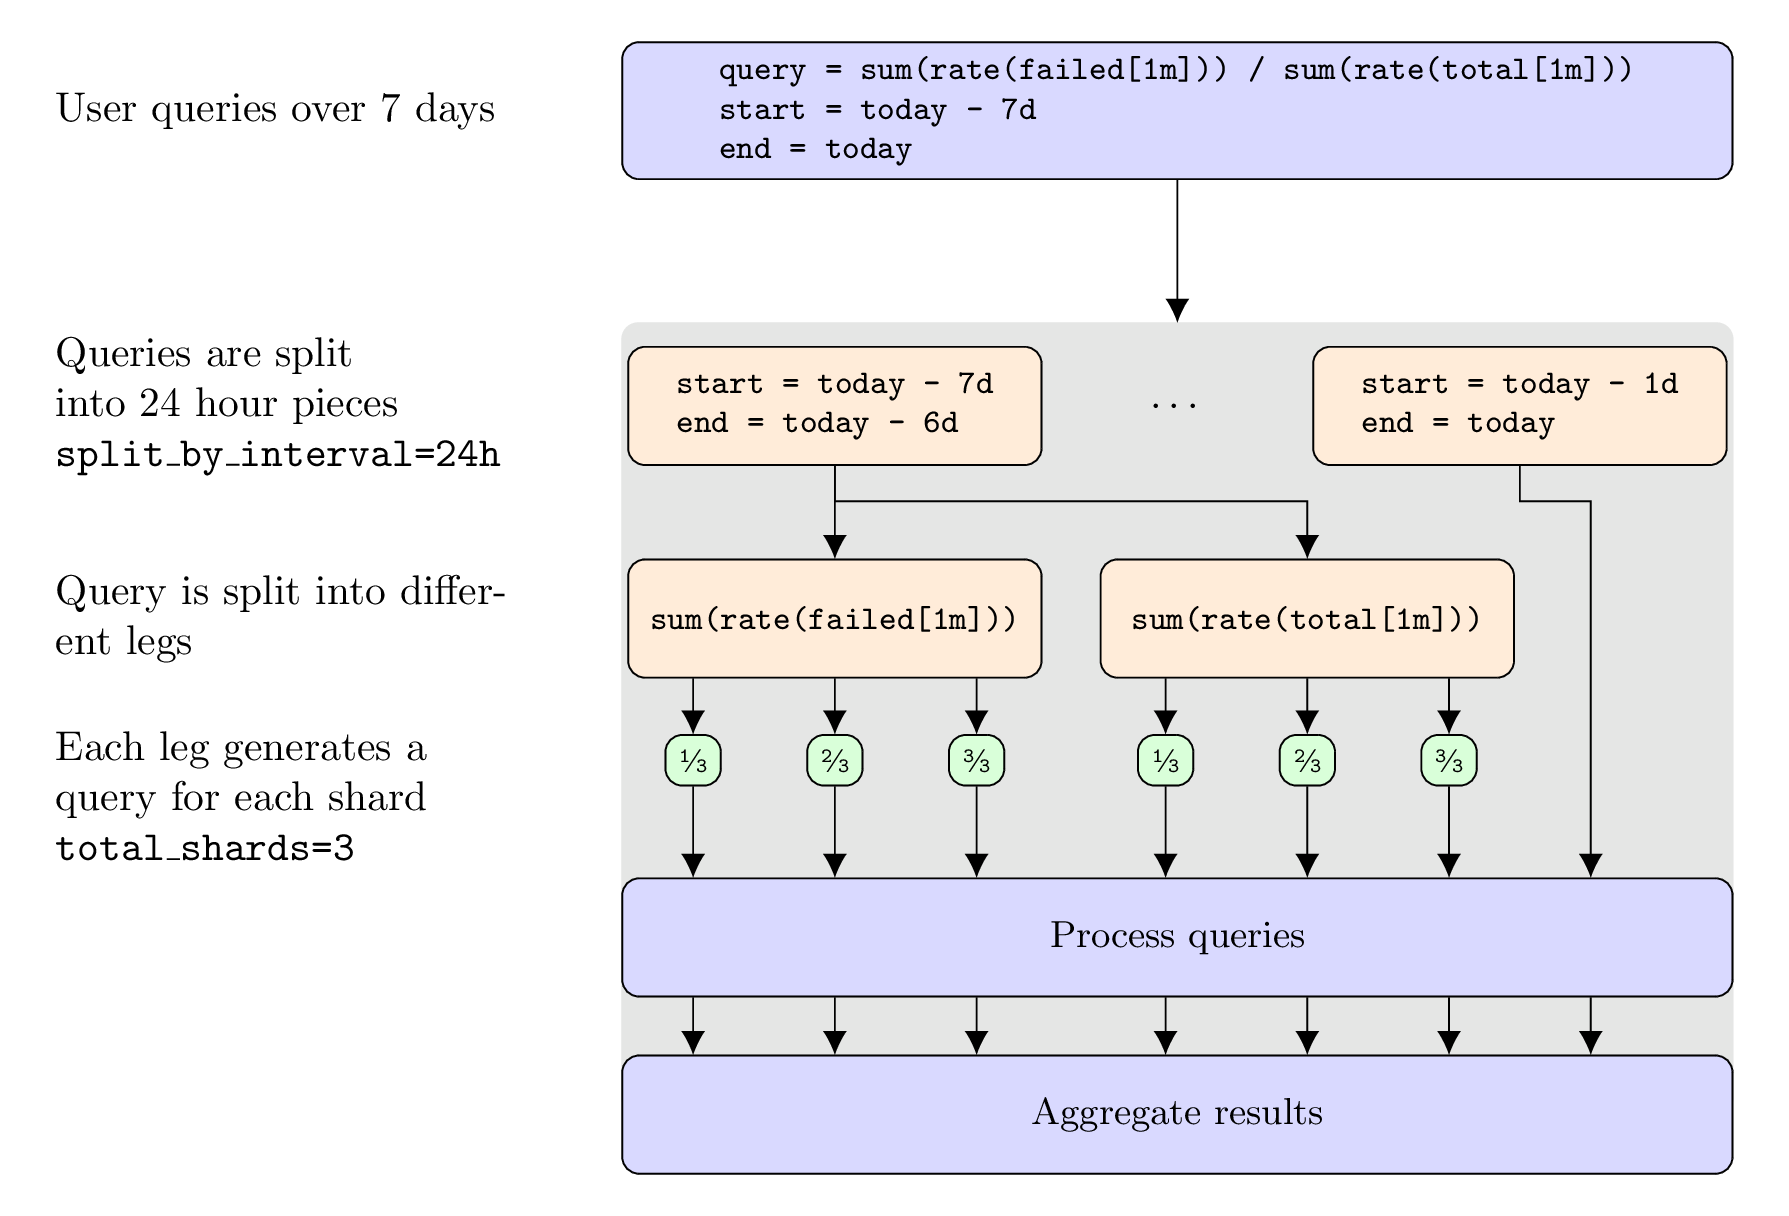
When running a query over a large time range and
-query-frontend.split-queries-by-interval is enabled, the
-query-frontend.query-sharding-max-sharded-queries limit applies on the total
number of queries which have been split by time (first) and by shards (second).
As an example, if -query-frontend.query-sharding-max-sharded-queries=128 and
-query-frontend.split-queries-by-interval=24h, and you run a query over 8 days, each
daily query will have a max of 128 / 8 days = 16 partial queries per day.
After enabling query sharding in a microservices deployment, the query frontends will start processing the aggregation of the partial queries. Hence it is important to configure some PromQL engine specific parameters on the query-frontend too:
-querier.max-concurrent-querier.timeout-querier.max-samples-querier.default-evaluation-interval-querier.lookback-delta
Operational considerations
Splitting a single query into sharded queries increases the quantity of queries that must be processed. Parallelization decreases the query processing time, but increases the load on querier components and their underlying data stores (ingesters for recent data and store-gateway for historic data). The caching layer for chunks and indexes will also experience an increased load.
We also recommend to increase the maximum number of queries scheduled in
parallel by the query-frontend, multiplying the previously set value of
-querier.max-query-parallelism by
-query-frontend.query-sharding-total-shards.
Verification
Query statistics
The query statistics logged by the query-frontend allow to check if query sharding was
used for an individual query. The field sharded_queries contains the amount
of parallelly executed partial queries.
When sharded_queries is 0, either the query is not shardable or query
sharding is disabled for cluster or tenant. This is a log line of an
unshardable query:
sharded_queries=0 param_query="absent(up{job=\"my-service\"})"When sharded_queries matches the configured shard count, query sharding is
operational and the query has only a single leg (assuming time splitting is
disabled or the query doesn’t span across multiple days). The following log
line represents that case with a shard count of 16:
sharded_queries=16 query="sum(rate(prometheus_engine_queries[5m]))"When sharded_queries is a multiple of the configured shard count, query
sharding is operational and the query has multiple legs (assuming time
splitting is disabled or the query doesn’t span across multiple days). The
following log line shows a query with two legs and with a configured shard
count of 16:
sharded_queries=32 query="sum(rate(prometheus_engine_queries{engine=\"ruler\"}[5m]))/sum(rate(prometheus_engine_queries[5m]))"The query-frontend also exposes metrics, which can be useful to understand the query workload’s parallelism as a whole.
You can run the following query to get the ratio of queries which have been successfully sharded:
sum(rate(cortex_frontend_query_sharding_rewrites_succeeded_total[$__rate_interval])) /
sum(rate(cortex_frontend_query_sharding_rewrites_attempted_total[$__rate_interval]))
The histogram cortex_frontend_sharded_queries_per_query allows to understand
how many sharded sub queries are generated per query.

