Menu
Important: This documentation is about an older version. It's relevant only to the release noted, many of the features and functions have been updated or replaced. Please view the current version.
Open source
Grafana Mimir Writes dashboard
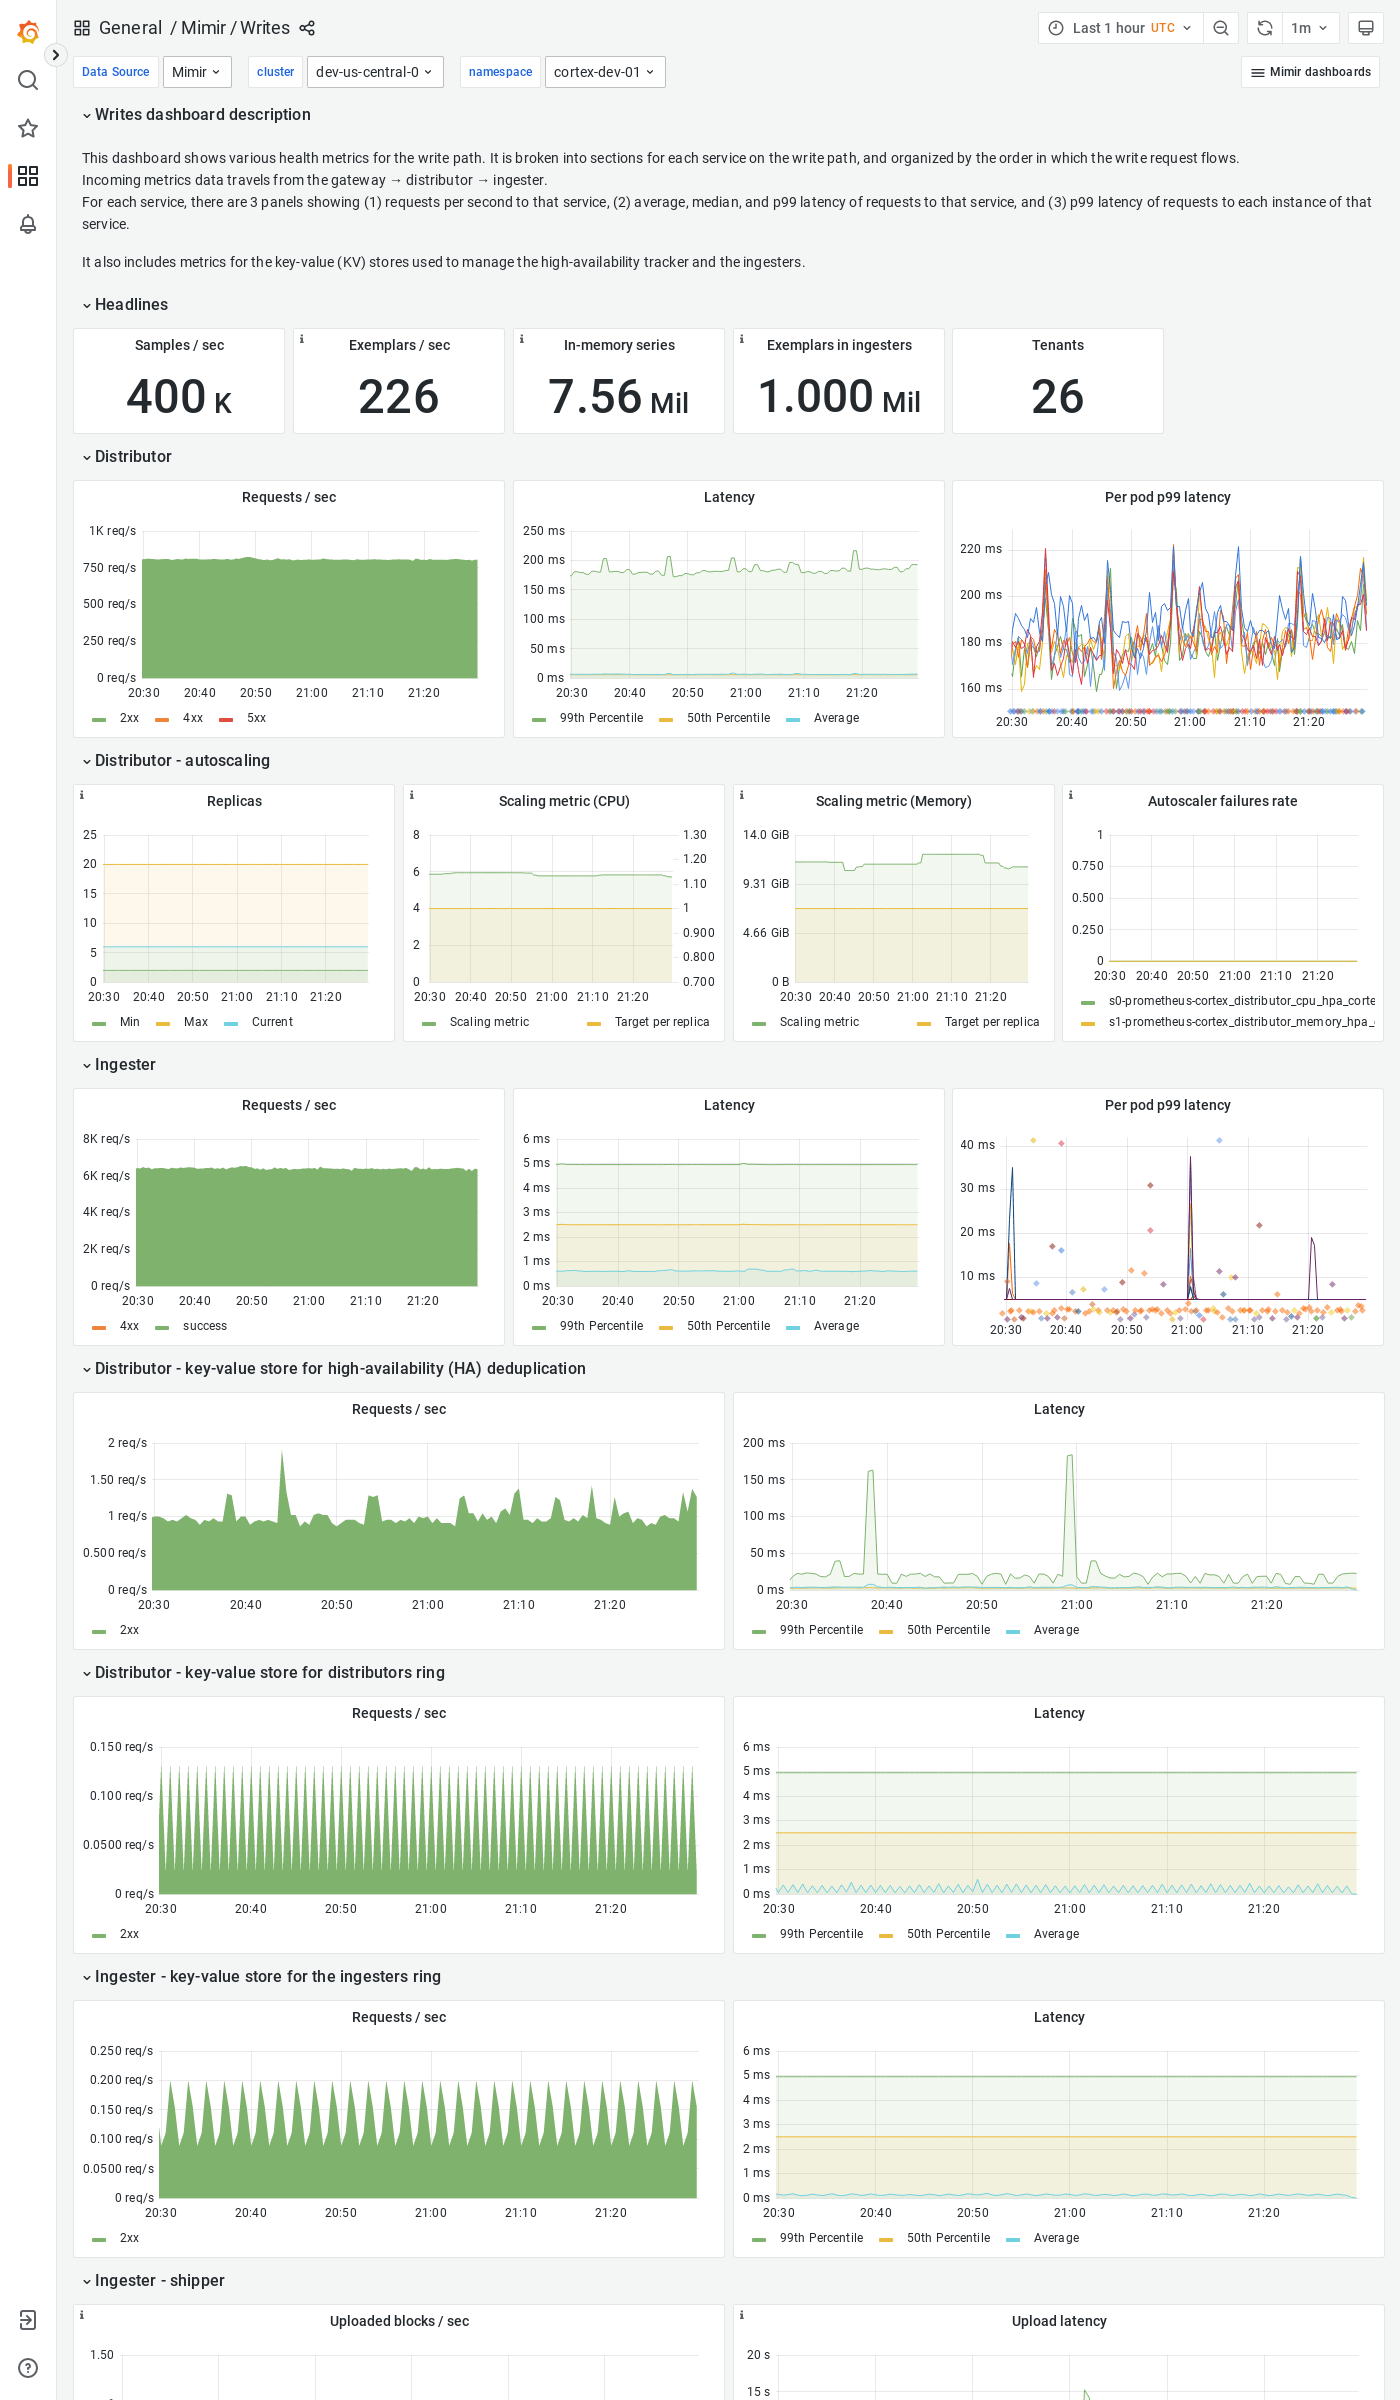
The Writes dashboard shows health metrics for the write path and object storage metrics for operations triggered by the write path.
The dashboard isolates each service on the write path into its own section and displays the order in which a write request flows.
Example
The following example shows a Writes dashboard from a demo cluster.