Menu
Important: This documentation is about an older version. It's relevant only to the release noted, many of the features and functions have been updated or replaced. Please view the current version.
Documentation Grafana Mimir
Operator and user guide
Monitor Mimir
Viewing dashboards
Remote ruler reads resources
Grafana Mimir
Operator and user guide
Monitor Mimir
Viewing dashboards
Remote ruler reads resources
Open source
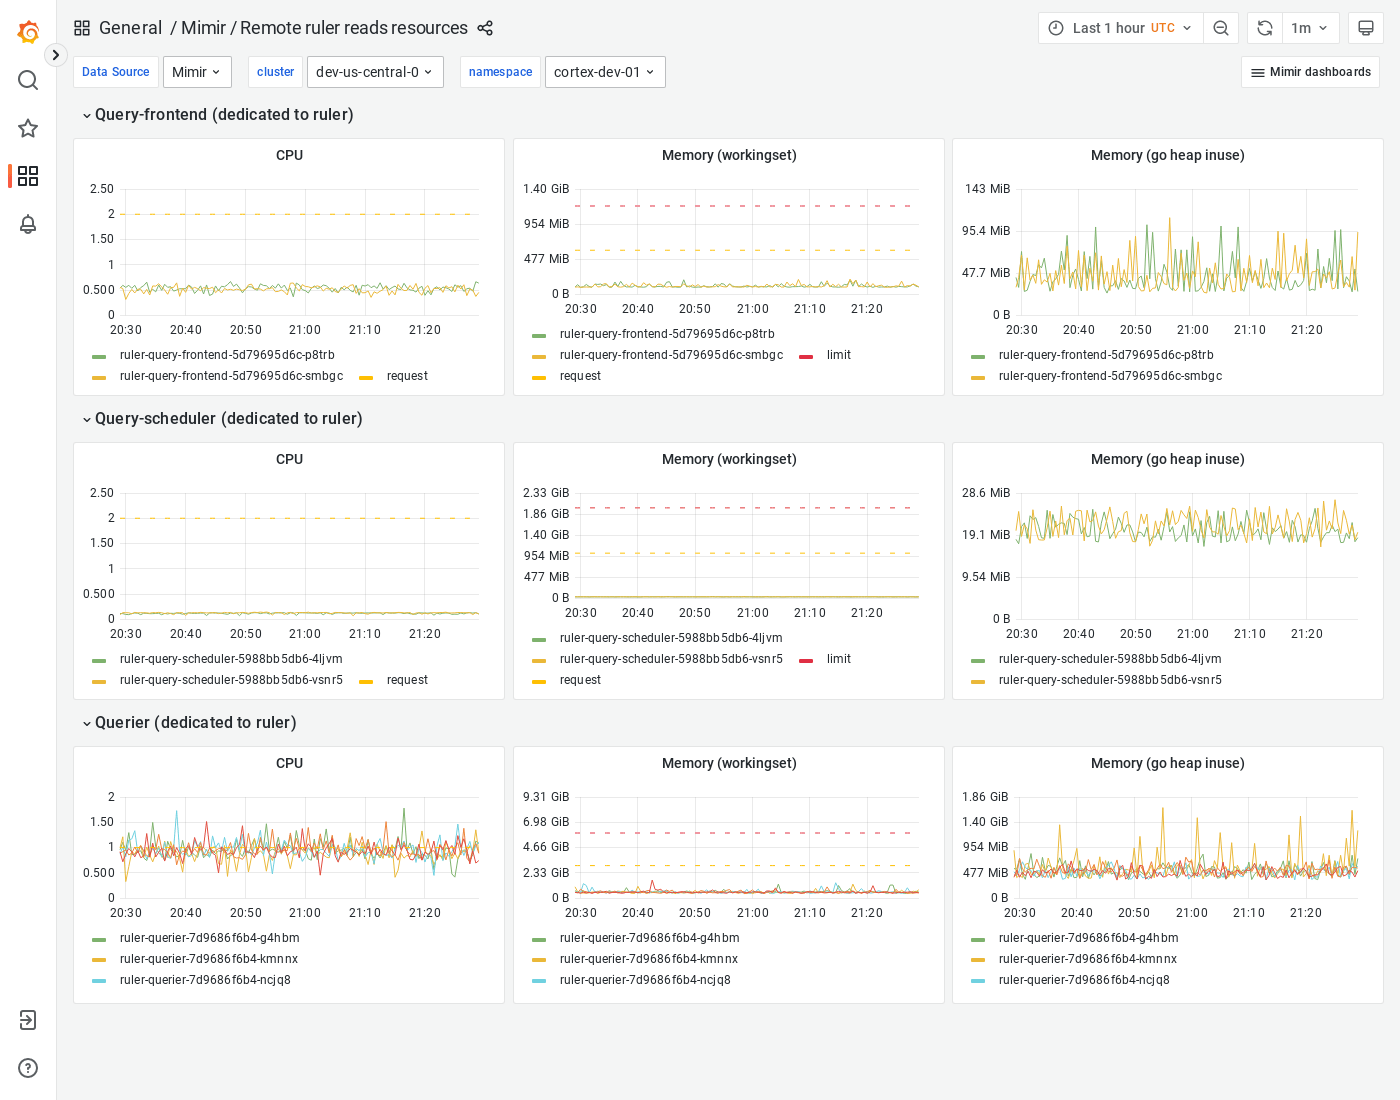
Grafana Mimir Remote ruler reads resources dashboard
The Remote ruler reads resources dashboard shows CPU, memory, disk, and other resources utilization metrics for ruler query path components when remote operational mode is enabled.
The dashboard isolates each service on the ruler read path into its own section and displays the order in which a read request flows.
This dashboard requires additional resources metrics.
Example
The following example shows a Remote ruler reads resources dashboard from a demo cluster.