
Grafana Mimir Queries dashboard
Important: This documentation is about an older version. It's relevant only to the release noted, many of the features and functions have been updated or replaced. Please view the current version.
Documentation Grafana Mimir
Operator and user guide
Monitoring Grafana Mimir
Viewing dashboards
Queries
Grafana Mimir
Operator and user guide
Monitoring Grafana Mimir
Viewing dashboards
Queries
Open source
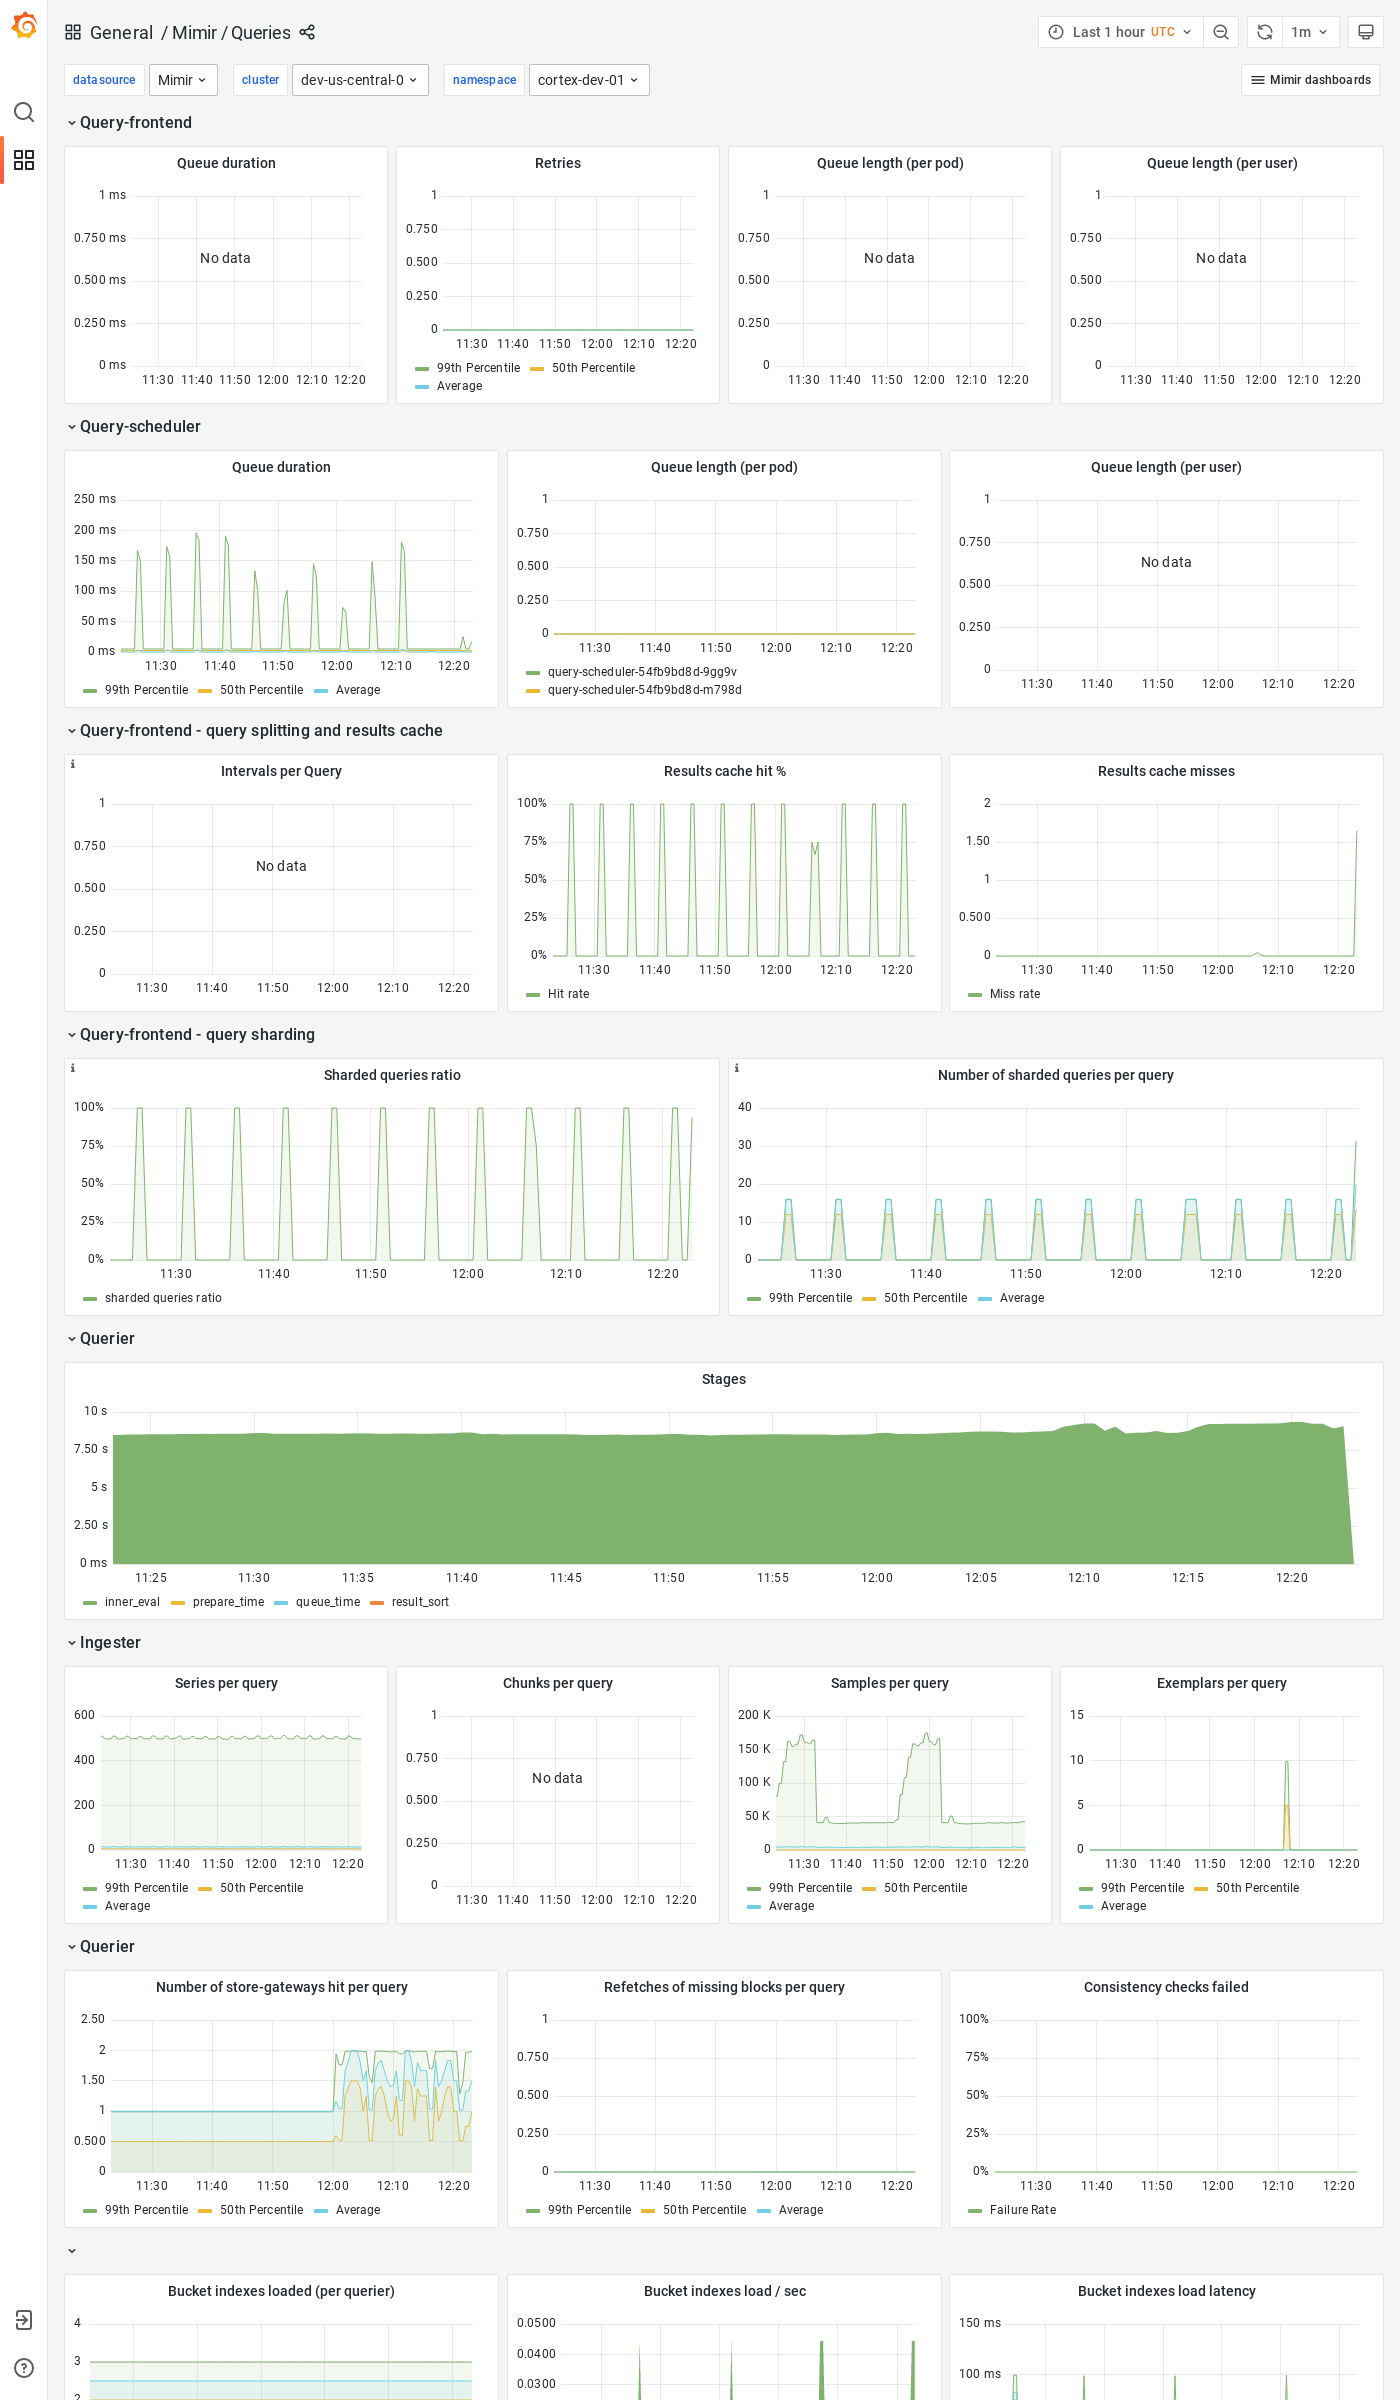
Grafana Mimir Queries dashboard
The Queries dashboard shows information about query queues, duration, retries, and details about query execution performance.
Example
The following example shows a Queries dashboard from a demo cluster.
Was this page helpful?
Related resources from Grafana Labs
60 min

Intro to metrics with Grafana: Prometheus, Grafana Mimir, and beyond
In this webinar, we’ll go over challenges when scaling metrics systems, with a particular focus on Prometheus and Grafana Mimir.
60 min

Scaling and securing your Prometheus metrics in Grafana Cloud
Learn how Grafana Cloud Metrics, powered by Grafana Mimir, overcomes Prometheus limitations with a fully managed, scalable service. Optimize cardinality, reduce costs, and scale seamlessly—no maintenance required.
Blog post

Less is more: How Grafana Mimir queries run faster and more cost efficiently with fewer indexes
By avoiding inverted index lookups in the Prometheus TSDB, Mimir's memory usage was reduced by up to 64%.