
Important: This documentation is about an older version. It's relevant only to the release noted, many of the features and functions have been updated or replaced. Please view the current version.
Add a query variable
Query variables allow you to write a data source query that can return a list of metric names, tag values, or keys. For example, a query variable might return a list of server names, sensor IDs, or data centers. The variable values change as they dynamically fetch options with a data source query.
Query expressions can contain references to other variables and in effect create linked variables. Grafana detects this and automatically refreshes a variable when one of its linked variables change.
Query expressions
Query expressions are different for each data source. For more information, refer to the documentation for your data source.
Enter General options
- Navigate to the dashboard you want to make a variable for and then click the Dashboard settings (gear) icon at the top of the page.
- On the Variables tab, click New.
- Enter a Name for your variable.
- In the Type list, select Query.
- (optional) In Label, enter the display name of the variable dropdown. If you don’t enter a display name, then the dropdown label will be the variable name.
- Choose a Hide option:
- No selection (blank) - The variable dropdown displays the variable Name or Label value. This is the default.
- Label - The variable dropdown only displays the selected variable value and a down arrow.
- Variable - No variable dropdown is displayed on the dashboard.
Enter Query Options
- In the Data source list, select the target data source for the query. For more information about data sources, refer to Add a data source.
- In the Refresh list, select when the variable should update options.
- Never - Variables queries are cached and values are not updated. This is fine if the values never change, but problematic if they are dynamic and change a lot.
- On Dashboard Load - Queries the data source every time the dashboard loads. This slows down dashboard loading, because the variable query needs to be completed before dashboard can be initialized.
- On Time Range Change - Queries the data source when the dashboard time range changes. Only use this option if your variable options query contains a time range filter or is dependent on the dashboard time range.
- In the Query field, enter a query.
- The query field varies according to your data source. Some data sources have custom query editors.
- If you need more room in a single input field query editor, then hover your cursor over the lines in the lower right corner of the field and drag downward to expand.
- (optional) In the Regex field, type a regex expression to filter or capture specific parts of the names return by your data source query. To see examples, refer to Filter variables with regex.
- In the Sort list, select the sort order for values to be displayed in the dropdown list. The default option, Disabled, means that the order of options returned by your data source query will be used.
Enter Selection Options
All selection options are optional, and they are off by default.
Multi-value
If you turn this on, then the variable dropdown list allows users to select multiple options at the same time. For more information, refer to Formatting multi-value variables.
Include All option
Grafana adds an All option to the variable dropdown list. If a user selects this option, then all variable options are selected.
Custom all value
This option is only visible if the Include All option is selected.
Enter regex, globs, or lucene syntax in the Custom all value field to define the value of the All option.
By default the All value includes all options in combined expression. This can become very long and can have performance problems. Sometimes it can be better to specify a custom all value, like a wildcard regex.
In order to have custom regex, globs, or lucene syntax in the Custom all value option, it is never escaped so you will have to think about what is a valid value for your data source.
Enter Value groups/tags (experimental feature)
If you have many options in the dropdown for a multi-value variable, then you can use this feature to group the values into selectable tags.
This feature is off by default. Click Enabled to turn on the feature.
Tags query
Enter a data source query that should return a list of tags. The tags query returns a list of tags that each represent a group, and the tag values query returns a list of group members.
For example, the tags query could be a list of regions (Europe, Asia, Americas), and then if the user selects the Europe tag, then the tag values query would return a list of countries – Sweden, Germany, France, and so on.
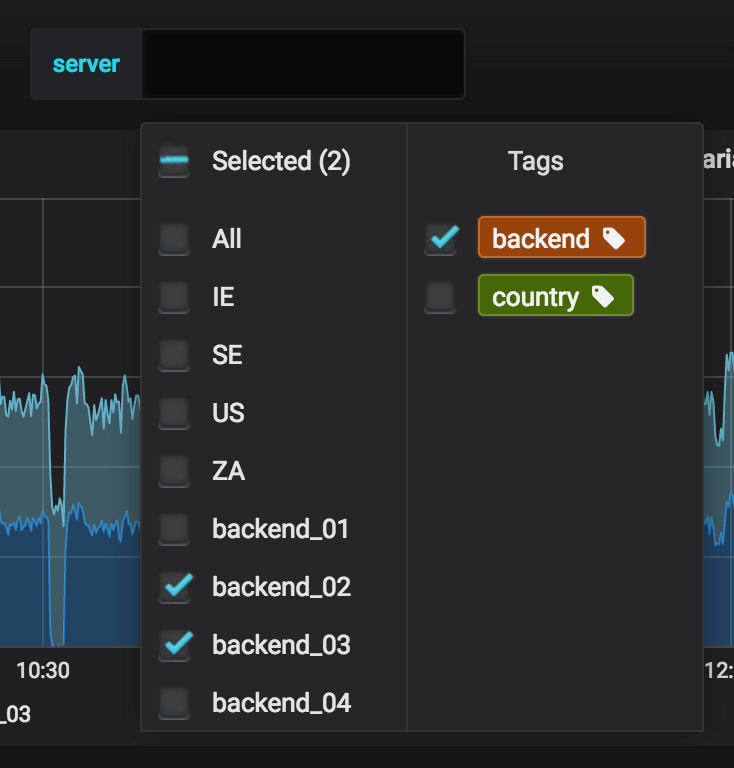
If you have a variable with a lot of values (say all the countries in the world), then this allows you to easily select a group of them. If the user selects the tag Europe, all the countries in Europe would be selected.
In this example dashboard, the server variable has tags enabled.
Tag values query
Enter a data source query that should return a list of values for a specified tag key. Use $tag in the query to refer the currently selected tag.
The $tag variable will have the value of the tag that the user chooses.
For example, if you have a Graphite query for tags, regions.*, that returns a list of regions. The the values query could be regions.$tag.*, which if the user chooses Europe would be interpolated to regions.Europe.*.
Final steps
- In Preview of values, Grafana displays a list of the current variable values. Review them to ensure they match what you expect.
- Click Add to add the variable to the dashboard.
Was this page helpful?
Related resources from Grafana Labs


