
Important: This documentation is about an older version. It's relevant only to the release noted, many of the features and functions have been updated or replaced. Please view the current version.
Time range controls
Note: Looking for prebuilt Grafana dashboards? Check out our full library of dashboards and more →
Grafana provides several ways to manage the time ranges of the data being visualized, both at the dashboard level and the panel level.
This page describes supported time units and relative ranges, the common time controls, dashboard-wide time settings, and panel-specific time settings.
Time units and relative ranges
The following time units are supported: s (seconds), m (minutes), h (hours), d (days), w (weeks), M (months), and y (years).
The minus operator allows you to step back in time, relative to now. If you wish to display the full period of the unit (day, week, month, etc…), append /<time unit> to the end.
The plus operator allows you to step forward in time relative to now. You might use this feature to look at predicted data in the future, for example.
Here are some examples:
| Example relative range | From: | To: |
|---|---|---|
| Last 5 minutes | now-5m | now |
| The day so far | now/d | now |
| This week | now/w | now/w |
| Week to date | now/w | now |
| Previous Month | now-1M/M | now-1M/M |
Common time range controls
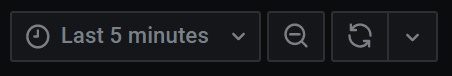
The dashboard and panel time controls have a common user interface (UI).
The options are defined below.
Current time range
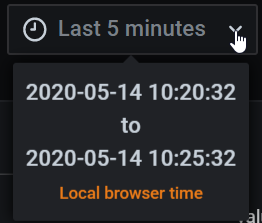
The current time range, also called the time picker, shows the time range currently displayed in the dashboard or panel you are viewing.
Hover your cursor over the field to see the exact time stamps in the range and their source (such as the local browser).
Click on the current time range to change the time range. You can change the current time using a relative time range, such as the last 15 minutes, or an absolute time range, such as 2020-05-14 00:00:00 to 2020-05-15 23:59:59.
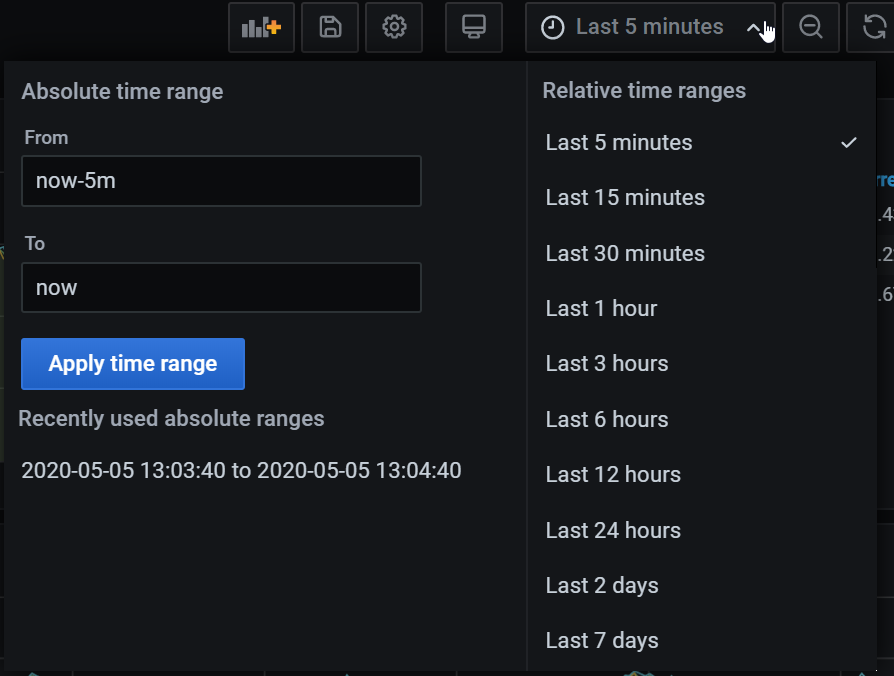
Relative time range
Select the relative time range from the Relative time ranges list. Some examples of time ranges are:
- Last 30 minutes
- Last 12 hours
- Last 7 days
- Last 2 years
- Yesterday
- Day before yesterday
- This day last week
- Today so far
- This week so far
- This month so far
Absolute time range
Set an absolute time range one of two ways:
- Type values into the From and To fields. You can type exact time values or relative values, such as
now-24h, and then click Apply time range. - Click in the From or To field. Grafana displays a calendar. Click the day or days you want to use as the current time range and then click Apply time range.
This section also displays recently used absolute ranges.
Zoom out (Cmd+Z or Ctrl+Z)
Click the Zoom out icon to view a larger time range in the dashboard or panel visualization.
Zoom in (only applicable to graph visualizations)
Click and drag to select the time range in the visualization that you want to view.
Refresh dashboard
Click the Refresh dashboard icon to immediately run every query on the dashboard and refresh the visualizations.
By default, Grafana does not automatically refresh the dashboard. Queries run on their own schedule according to the panel settings. However, if you want to regularly refresh the dashboard, then click the down arrow next to the Refresh dashboard icon and then select a refresh interval.
Dashboard time settings
Time settings are saved on a per-dashboard basis.
To access the dashboard time settings, click the Dashboard settings (gear) icon at the top of the screen. The settings are in the Time Options section of the General tab.
- Timezone - Specify the local time zone of the service or system that you are monitoring. This can be helpful when monitoring a system or service that operates across several time zones.
- Default - The default selected time zone for the user profile, team, or organization is used. If no time zone is specified for the user profile, a team the user is a member of, or the organization, then Grafana uses local browser time.
- Local browser time - The time zone configured for the viewing user browser is used. This is usually the same time zone as set on the computer.
- Standard ISO 8601 time zones, including UTC.
- Auto-refresh - Customize the options displayed for relative time and the auto-refresh options. Entries are comma separated and accept any valid time unit.
- Now delay now- - Override the
nowvalue by entering a time delay. Most commonly, this feature is used to accommodate known delays in data aggregation to avoid null values. - Hide time picker - Select this option if you do not want Grafana to display the time picker.
Panel time overrides and timeshift
In Query options, you can override the relative time range for individual panels, causing them to be different than what is selected in the dashboard time picker in the upper right. This allows you to show metrics from different time periods or days at the same time.
Control the time range using a URL
Time range of a dashboard can be controlled by providing following query parameters in the dashboard URL:
from- defines lower limit of the time range, specified in ms epoch or relative timeto- defines upper limit of the time range, specified in ms epoch or relative timetimeandtime.window- defines a time range fromtime-time.window/2totime+time.window/2. Both params should be specified in ms. For example?time=1500000000000&time.window=10000will result in 10s time range from 1499999995000 to 1500000005000
Was this page helpful?
Related resources from Grafana Labs


