Important: This documentation is about an older version. It's relevant only to the release noted, many of the features and functions have been updated or replaced. Please view the current version.
What’s new in Grafana v6.6
For all details, read the full CHANGELOG.md.
Highlights
Grafana 6.6 comes with a lot of new features and enhancements:
- Panels: New stat panel
- Panels: Auto min/max for Bar Gauge/Gauge/Stat
- Panels: News panel
- Panels: Custom data units
- Panels: Bar Gauge unfilled option
- TimePicker: New design & features
- Alerting enhancements
- Explore: Added log message line wrapping options for logs
- Explore: Column with unique log labels
- Explore: Context tooltip
- Explore: Added ability to specify step with Prometheus queries
- Graphite: Added Metrictank dashboard to Graphite datasource
- Loki: Support for template variable queries
- Postgres/MySQL/MSSQL: Added support for region annotations
- Security: Added disabled option for cookie samesite attribute
- TablePanel, GraphPanel: Exclude hidden columns from CSV
- Enterprise: White labeling
- Enterprise: APT and YUM repositories
- Stackdriver: Meta labels
- CloudWatch: Calculate period based on time range
- CloudWatch: Display partial result in graph when max DP/call limit is reached
New stat panel
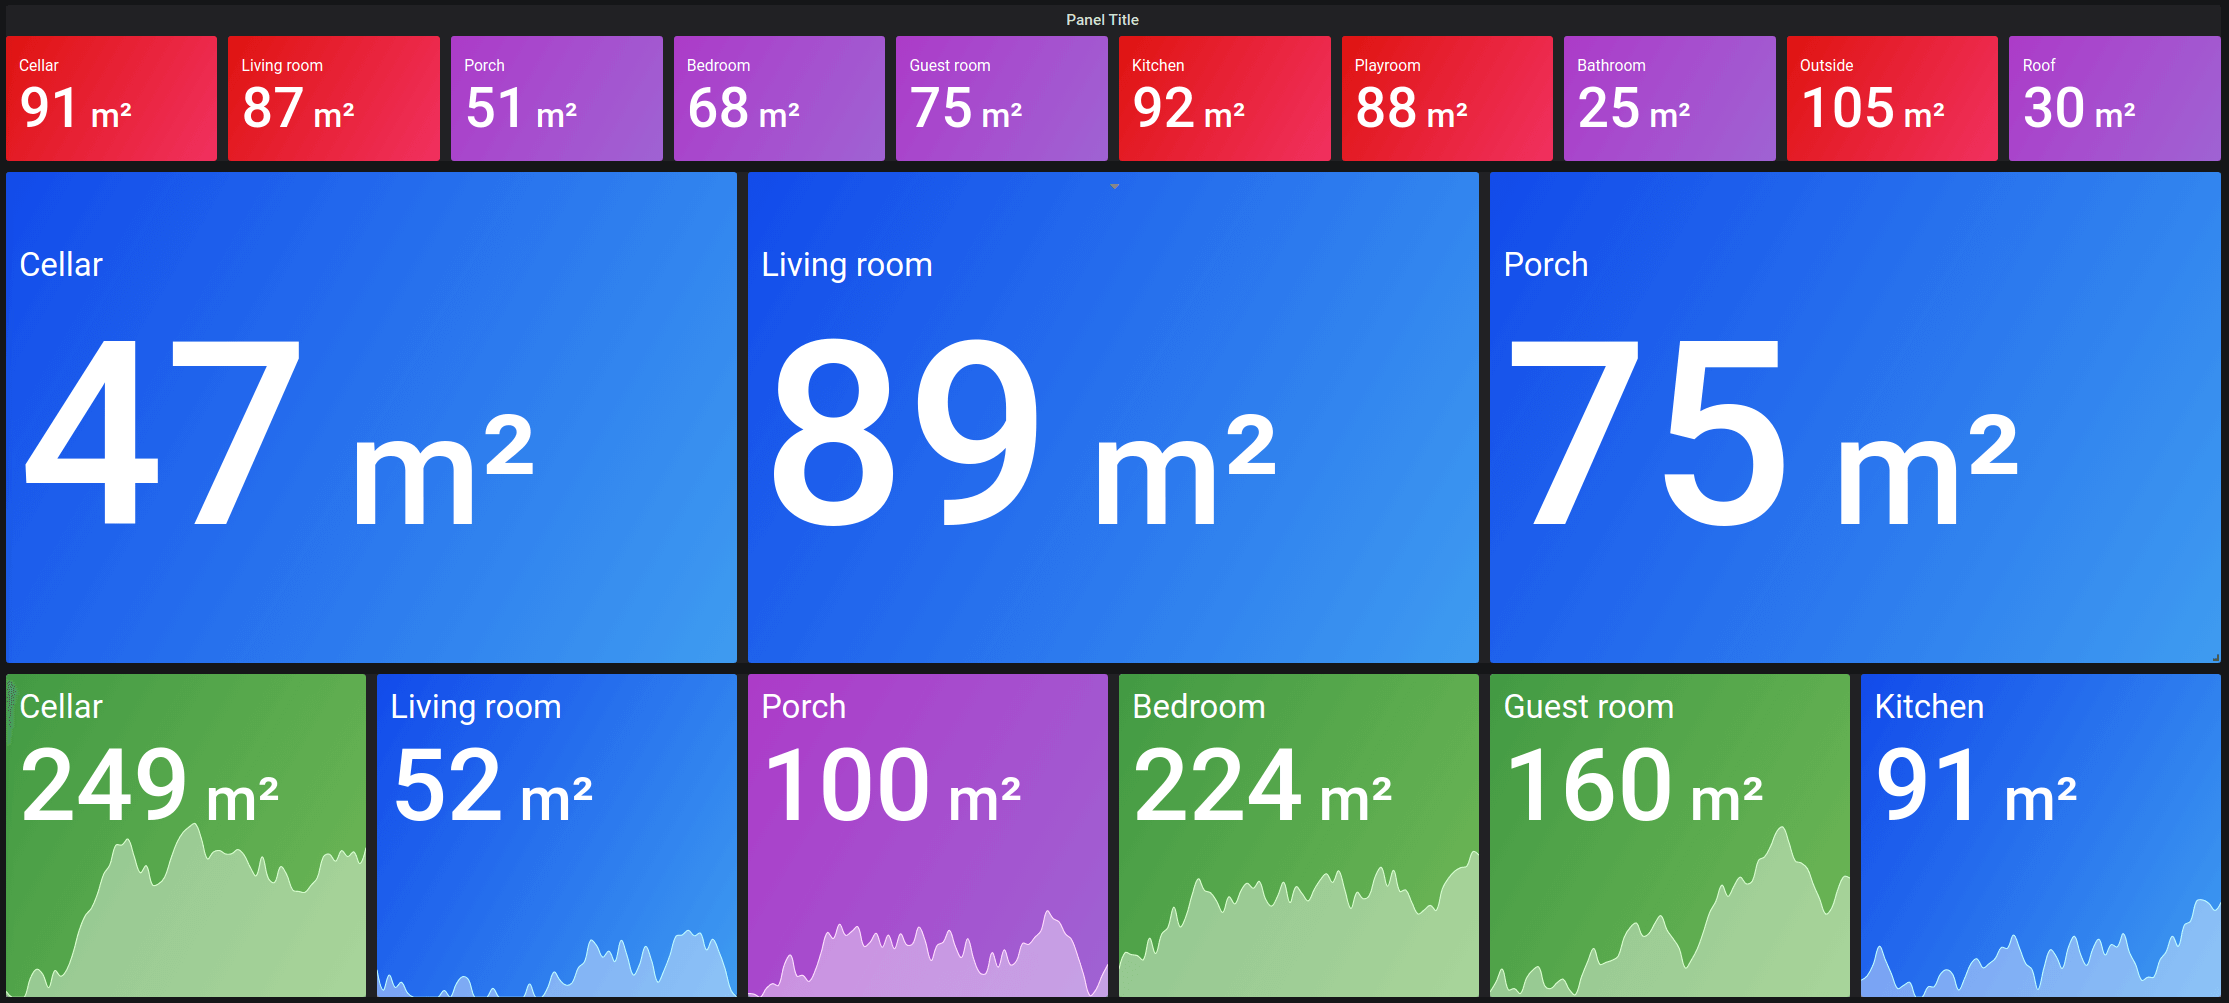
This release adds a new panel named Stat. This panel is designed to replace the current Singlestat as the primary way to show big single number panels along with a sparkline. This panel is of course building on our new panel infrastructure and option design. So you can use the new threshold UI and data links. It also supports the same repeating feature as the Gauge and Bar Gauge panels, meaning it will repeat a separate visualization for every series or row
in the query result.
Key features:
- Automatic font size handling
- Automatic layout handling based on panel size
- Colors based on thresholds that adapt to light or dark theme
- Data links support
- Repeats horizontally or vertically for every series, row, or column
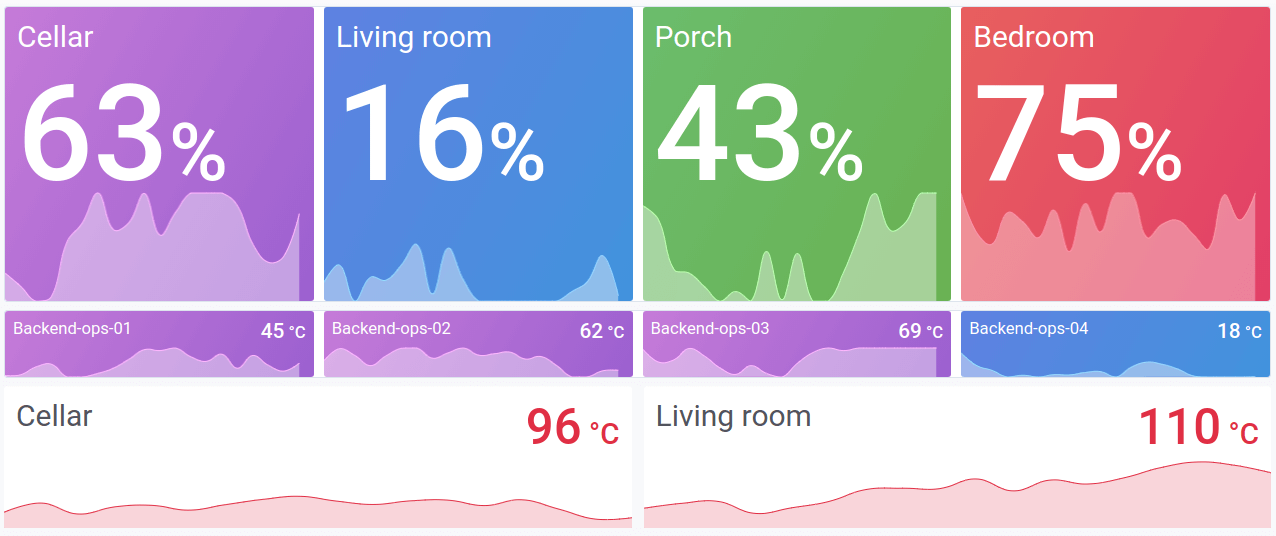
Here is how it looks in light theme:
Auto min-max
For the panels Gauge, Bar Gauge, and Stat, you can now leave the min and max settings empty. Grafana will, in that case, calculate the min and max based on all the data.
News panel
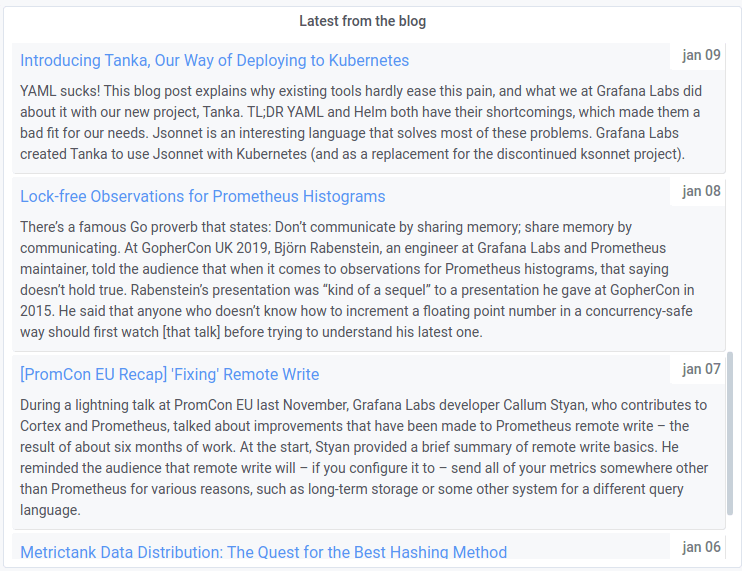
This panel shows RSS feeds as news items in the default home dashboard for v6.6. Add it to your custom home dashboards to keep up-to-date with Grafana news, or switch the default RSS feed to one of your choice.
Custom data units
A top feature request for years is now finally here. All panels now support custom units. Type any text in the unit picker and select the Custom: <your unit> option. By default, the text will be used as a suffix unit. If you want a custom prefix, then type prefix: <your unit> to make the custom unit appear before the value. If you want a custom SI unit (with auto SI suffixes) specify si:Ups. A value like 1000 will be rendered as 1 kUps.
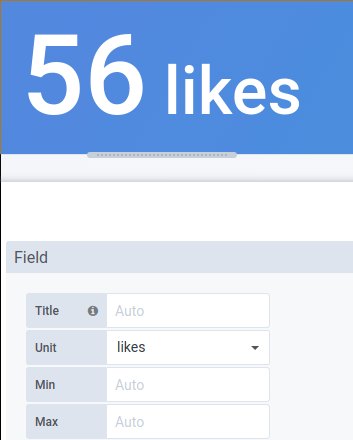
You can also paste a native emoji in the unit picker and pick it as a custom unit:
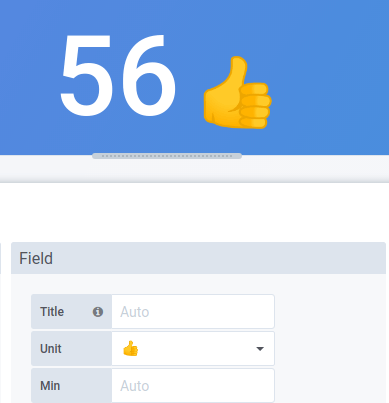
Bar Gauge unfilled option
The Bar Gauge visualization has a new display option: Unfilled. This new option is enabled by default, so it will change how this visualization is displayed on old dashboards. If you prefer the old default – in which an unfilled area is not shown and the value follows directly after – you have to update the visualization settings.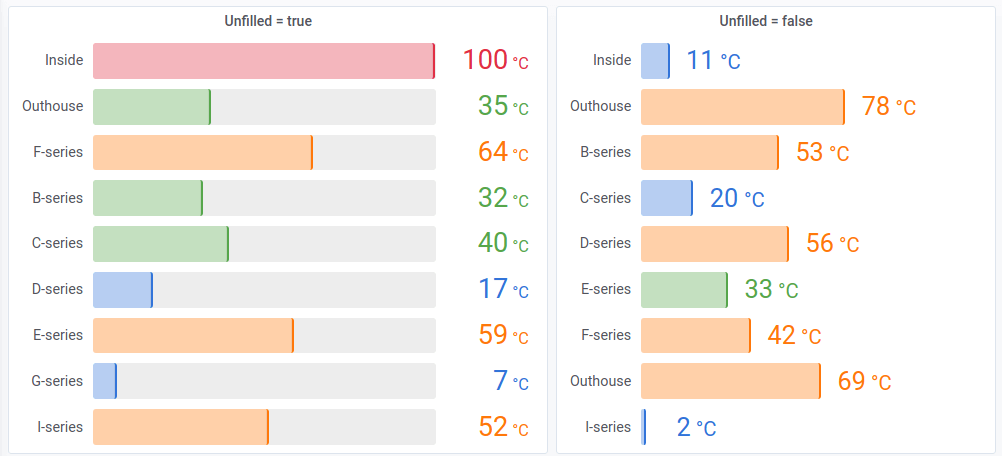
New time picker
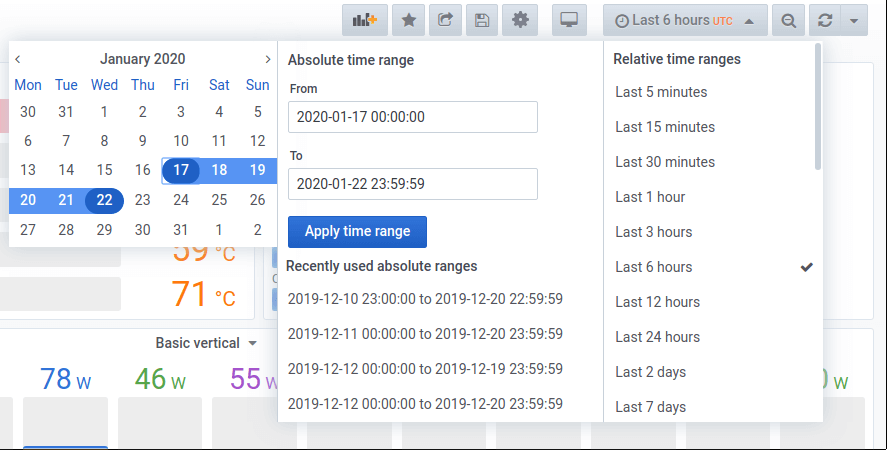
The time picker has gotten a major design update. Key changes:
- Quickly access the absolute from and to input fields without an extra click.
- Calendar automatically shows when from or to inputs have focus.
- A single calendar view can be used to select and show the from and to date.
- You can now select recent absolute ranges.
Alerting enhancements
- We have introduced a new configuration for enforcing a minimal interval between evaluations to reduce load on the backend.
- The email notifier can now optionally send a single email to all recipients.
- OpsGenie, PagerDuty, Threema, and Google Chat notifiers have been updated to send additional information.
Cookie management modifications
In order to align with a change in Chrome 80, a breaking change has been introduced to Grafana’s cookie_samesite setting. Grafana now properly renders cookies with the SameSite=None attribute when this setting is none. The previous behavior of none was to omit the SameSite attribute from cookies. Grafana will use the previous behavior when cookie_samesite is set to disabled.
Read more about this in the upgrade notes.
Explore/Logs Panel: Log message line wrapping options
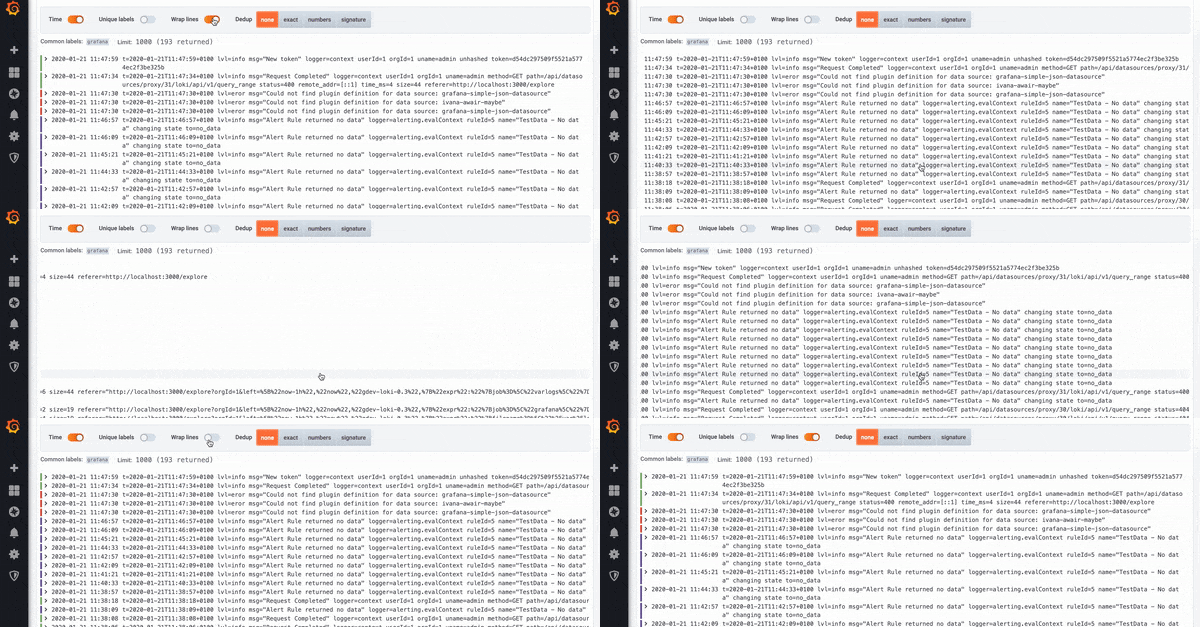
We introduced the wrap-lines option for logs because as for some of our users feel it’s more efficient to see one line per log message. The wrapped-line option is set as a default; the unwrapped setting results in horizontal scrolling.
Explore/Logs Panel: Column with unique log labels
After feedback from our community, we have decided to reintroduce a labels column. However, for better readability and usefulness, we have transformed it into a Unique labels column which includes only non-common labels. All common labels are displayed above.

Explore: Context tooltip
Isolating a series from a big set of lines in a graph is important for drill-downs. That’s why we have implemented the context tooltip in Explore, which allows you to copy data and labels from it to further refine the query.

Enterprise: White labeling
This release adds new white labeling options to the grafana.ini file (can also be set via ENV variables).
[white_labeling]
# Set to complete URL to override login logo
login_logo = https://my.logo.url/images/logo.png

# Set to complete css background expression to override login background
login_background = url(http://www.bhmpics.com/wallpapers/starfield-1920x1080.jpg)

# Set to complete URL to override menu logo
menu_logo = https://my.logo.url/images/logo_icon.png

# Set to complete URL to override fav icon (icon shown in browser tab)
fav_icon = https://my.logo.url/images/logo_icon_32px.png

# Set to complete URL to override apple/ios icon
apple_touch_icon = https://my.logo.url/images/logo_icon_32px.png

# Below is an example for how to replace the default footer & help links with 2 custom links
footer_links = support guides
footer_links_support_text = Support
footer_links_support_url = http://your.support.site
footer_links_guides_text = Guides
footer_links_guides_url = http://your.guides.site
Customize the login page, side menu bar, and footer links.

Enterprise APT and YUM repositories
Now you can install the enterprise edition from the APT and YUM repository. The following table shows the APT repository for each Grafana version (for instructions read the installation notes) :
| Grafana Version | Package | Repository |
|---|---|---|
| Grafana OSS | grafana | https://packages.grafana.com/oss/deb stable main |
| Grafana OSS (Beta) | grafana | https://packages.grafana.com/oss/deb beta main |
| Grafana Enterprise | grafana-enterprise | https://packages.grafana.com/enterprise/deb stable main |
| Grafana Enterprise (Beta) | grafana-enterprise | https://packages.grafana.com/enterprise/deb beta main |
The following table shows the YUM repositories for each Grafana version (for instructions read the installation notes) :
| Grafana Version | Package | Repository |
|---|---|---|
| Grafana OSS | grafana | https://packages.grafana.com/oss/rpm |
| Grafana OSS (Beta) | grafana | https://packages.grafana.com/oss/rpm-beta |
| Grafana Enterprise | grafana-enterprise | https://packages.grafana.com/enterprise/rpm |
| Grafana Enterprise (Beta) | grafana-enterprise | https://packages.grafana.com/enterprise/rpm-beta |
We recommend all users to install the Enterprise Edition of Grafana, which can be seamlessly upgraded with a Grafana Enterprise subscription.
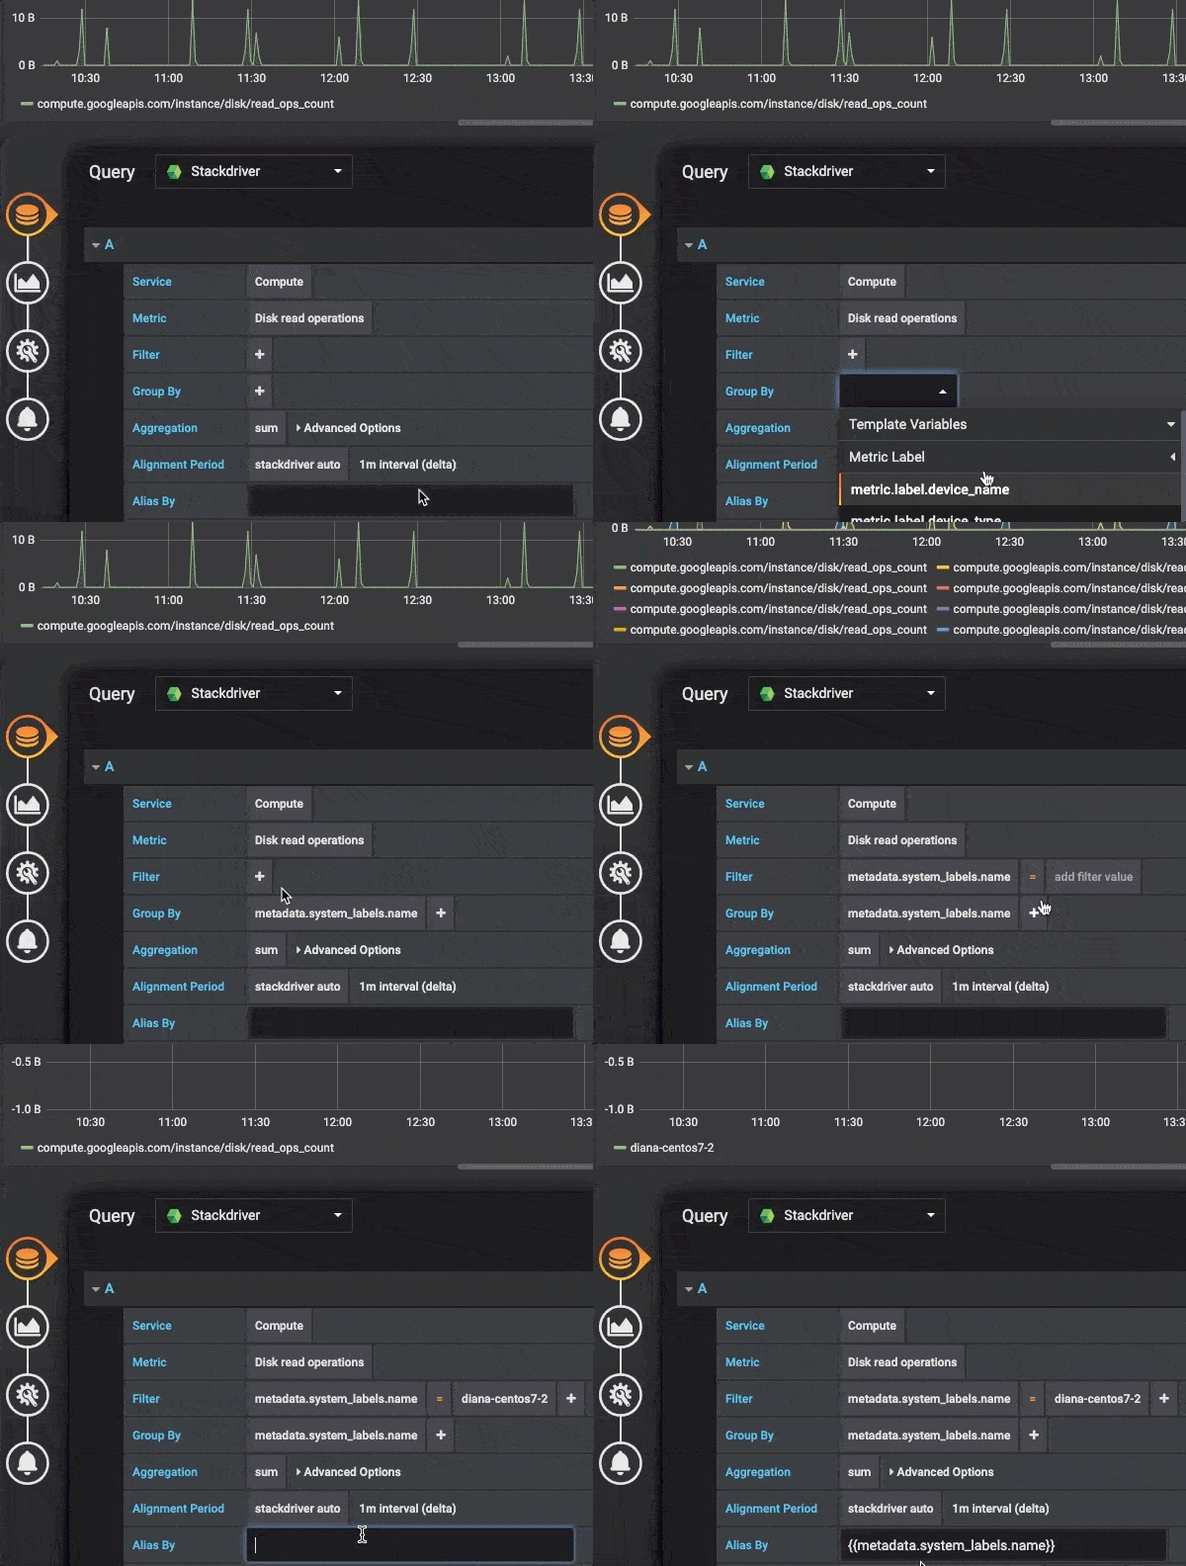
Stackdriver: Meta labels
From now on it will be possible to utilize meta data label in group bys, filters and in the alias field. Unfortunaltey there’s no API to retrieve all the labels, but the group by field dropdown comes with a pre-defined list of common system labels. User labels cannot be pre-defined, but it’s possible to enter them manually in the group by field. If a meta data label, user label or system label, is included in the group by segment, it will be possible to create filters based on it and to expand its value on the alias field.
CloudWatch: Calculate period based on time range
When the period field was left blank in Grafana 6.5, it would default to 60 seconds. In case users issued queries with a large time span, there was a high risk that they would reach the 100,800 data points per request limit in the Get Metric Data (GMD) API. When the period field is left blank in Grafana 6.6, the period will be calculated automatically based on the time range. The formula that is used is time range in seconds / 2000, and then we snap to next higher value in an array of pre-defined periods [60, 300, 900, 3600, 21600, 86400]. This will reduce the risk for receiving a Too many datapoints requested error in the panel.
CloudWatch: Display partial result in graph when max data points per call limit is reached
In case all queries in a GMD call are metric stat (not using math expressions), Grafana will paginate the response until all data points are received. But pagination is not supported in case a math expression is being used, so in that case it’s not possible to receive more than 100,800 data points. Previously when that limit was reached, we only displayed an error message. In Grafana 6.6, we also display the 100,800 data points that were received in the graph.
Upgrading
See upgrade notes.
Changelog
Check out CHANGELOG.md for a complete list of new features, changes, and bug fixes.
Notice about upcoming changes in backendSrv for plugin authors
In our mission to migrate away from AngularJS to React we have removed all AngularJS dependencies in the core data retrieval service backendSrv. This change is already in master and will be introduced in the next major Grafana release.
Removing the AngularJS dependencies in backendSrv has the unfortunate side effect of AngularJS digest no longer being triggered for any request made with backendSrv. Because of this, external plugins using backendSrv directly may suffer from strange behaviour in the UI.
To remedy this issue as a plugin author you need to trigger the digest after a direct call to backendSrv.
Example:
backendSrv.get(‘http://your.url/api’).then(result => {
    this.result = result;
    this.$scope.$digest();
});


