
Important: This documentation is about an older version. It's relevant only to the release noted, many of the features and functions have been updated or replaced. Please view the current version.
Transformations
This page explains what transformations in Grafana are and how to use them.
Note: This documentation refers to a Grafana 7.0 feature. This documentation will be frequently updated to reflect updates to the feature, and it will probably be broken into smaller sections when the feature moves out of beta.
Transformations process the result set before it’s passed to the visualization. You access transformations in the Transform tab of the Grafana panel editor.
Transformations allow you to rename fields, join separate time series together, do math across queries, and more. For users, with large dashboards or with heavy queries, being able to reuse the query result from one panel in another panel can be a huge performance gain.
Note: Transformations sometimes result in data that cannot be graphed. When that happens, Grafana displays a suggestion on the visualization that you can click to switch to table visualization. This often helps you better understand what the transformation is doing to your data.
Transformation execution order
Grafana applies transformations in the sequence that they are listed on the screen. Every transformation creates a new result set that is passed to the next transformation in the pipeline.
The order can make a huge difference in how your results look. For example, if you use a Reduce transformation to condense all the results of one column to a single value, then you can only apply transformations to that single value.
Prerequisites
Before you apply transformations, all of the following must be true:
- You have entered a query and returned data from a data source. For more information about queries, refer to Queries.
- You have applied a visualization that supports queries, such as:
Apply a transformation
Transformations are available from the Transform tab in the bottom pane of the panel editor, next to the Queries tab.
Navigate to the panel that you want to add transformations, click the panel title and then click Edit.
Click the Transform tab.
Click a transformation to select it.
A transformation row appears that allows you to configure the transformation options.
Click Add transformation to apply another transformation. Keep in mind that the next transformation acts on the result set returned by the previous transformation.
If you have trouble, click the bug icon to debug your transformations.
Click the trash can icon to remove a transformation.
Transformation types and options
Grafana comes with the following transformations:
Keep reading for detailed descriptions of each type of transformation and the options available for each, as well as suggestions on how to use them.
Reduce
Apply a Reduce transformation when you want to simplify your results down to one value. Reduce basically removes time component. If visualized as a table, it reduces a column down to one row (value).
In the Calculations field, enter one or more calculation types. Click to see a list of calculation choices. For information about available calculations, refer to the Calculation list.
Once you select at least one calculation, Grafana reduces the results down to one value using the calculation you select. If you select more than one calculation, then more than one value is displayed.
Here’s an example of a table with time series data. Before I apply the transformation, you can see all the data organized by time.

After I apply the transformation, there is no time value and each column has been reduced to one row showing the results of the calculations that I chose.

Merge
Note: This documentation refers to a Grafana 7.1 feature.
Use this transformation to combine the result from multiple queries into one single result. This is helpful when using the table panel visualization. Values that can be merged are combined into the same row. Values are mergeable if the shared fields contains the same data.
In the example below, we have two queries returning table data. It is visualized as two separate tables before applying the transformation.
Query A:
| Time | Job | Uptime |
|---|---|---|
| 2020-07-07 11:34:20 | node | 25260122 |
| 2020-07-07 11:24:20 | postgre | 123001233 |
Query B:
| Time | Job | Errors |
|---|---|---|
| 2020-07-07 11:34:20 | node | 15 |
| 2020-07-07 11:24:20 | postgre | 5 |
Here is the result after applying the Merge transformation.
| Time | Job | Errors | Uptime |
|---|---|---|---|
| 2020-07-07 11:34:20 | node | 15 | 25260122 |
| 2020-07-07 11:24:20 | postgre | 5 | 123001233 |
Filter by name
Use this transformation to remove portions of the query results.
Grafana displays the Identifier field, followed by the fields returned by your query.
You can apply filters in one of two ways:
- Enter a regex expression.
- Click a field to toggle filtering on that field. Filtered fields are displayed with dark gray text, unfiltered fields have white text.
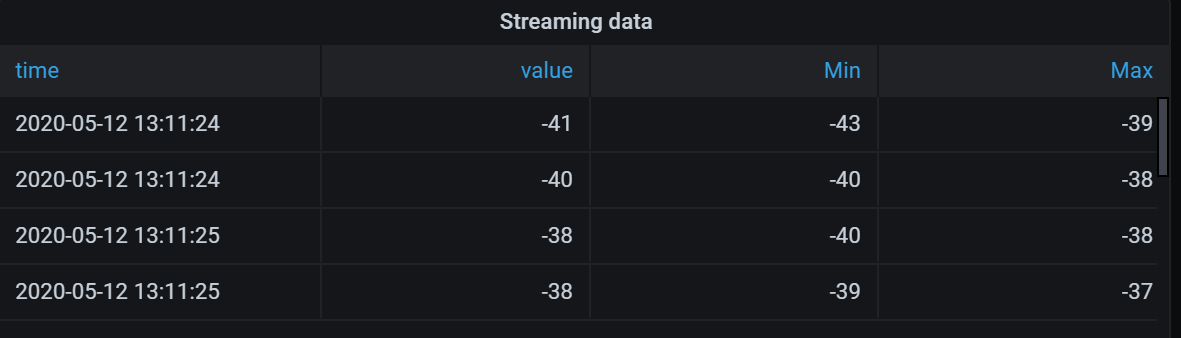
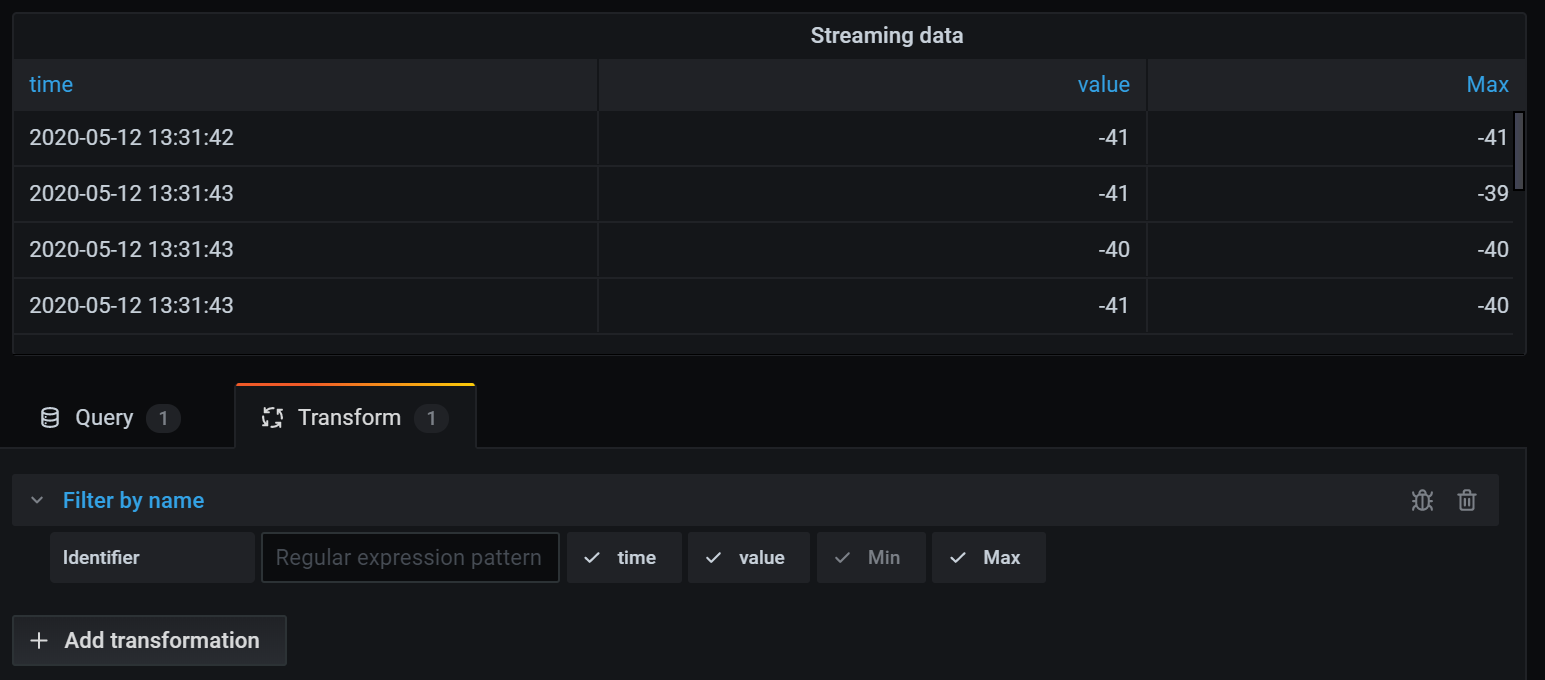
In the example below, I removed the Min field from the results.
Here is the original query table. (This is streaming data, so numbers change over time and between screenshots.)
Here is the table after I applied the transformation to remove the Min field.
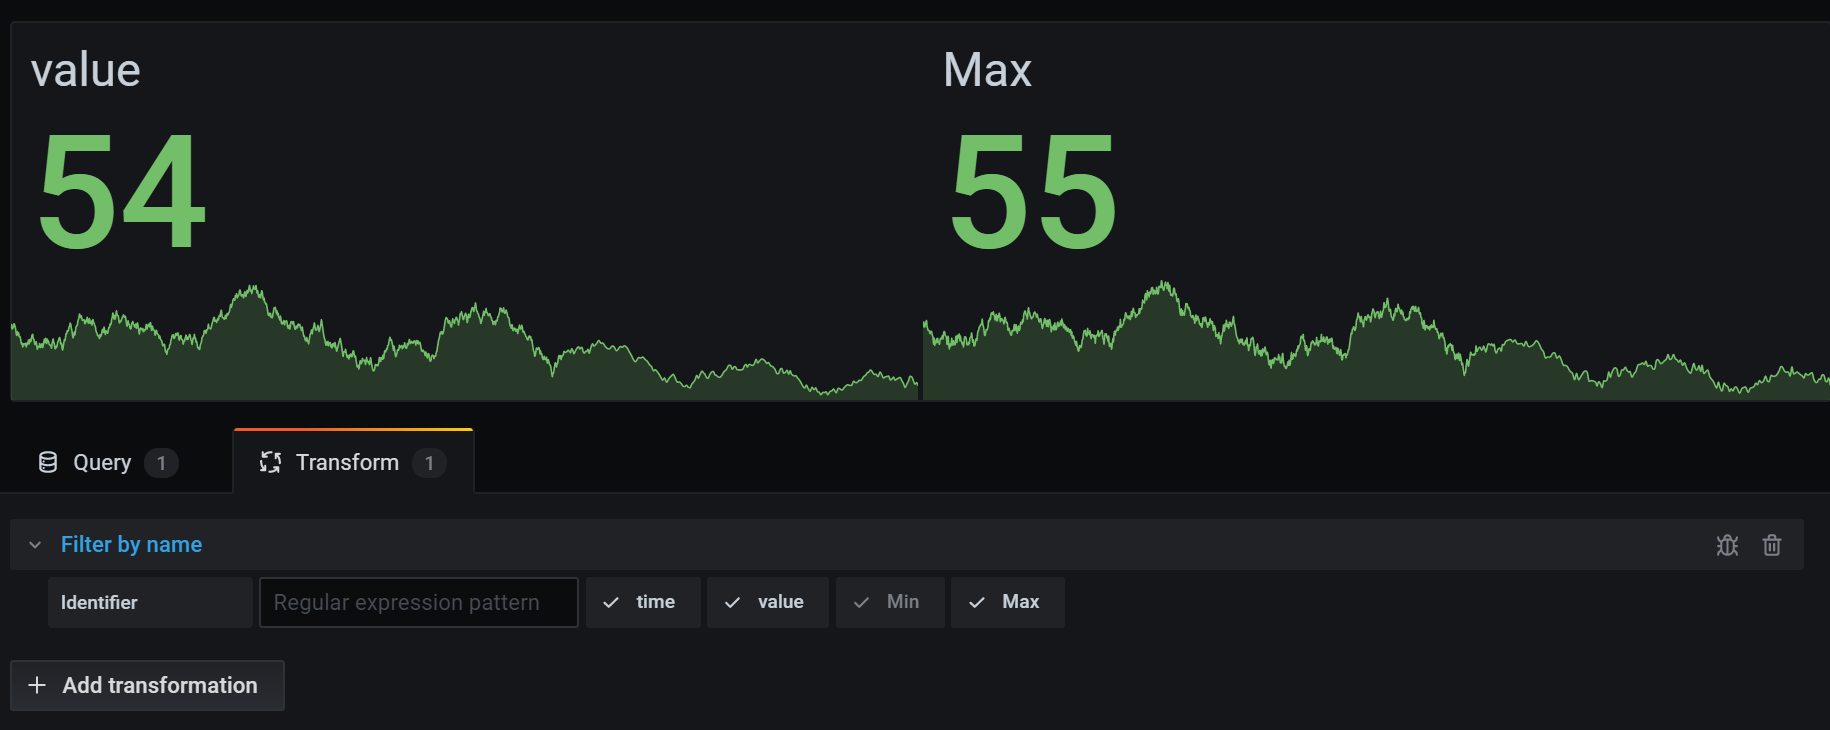
Here is the same query using a Stat visualization.
Filter data by query
Use this transformation in panels that have multiple queries, if you want to hide one or more of the queries.
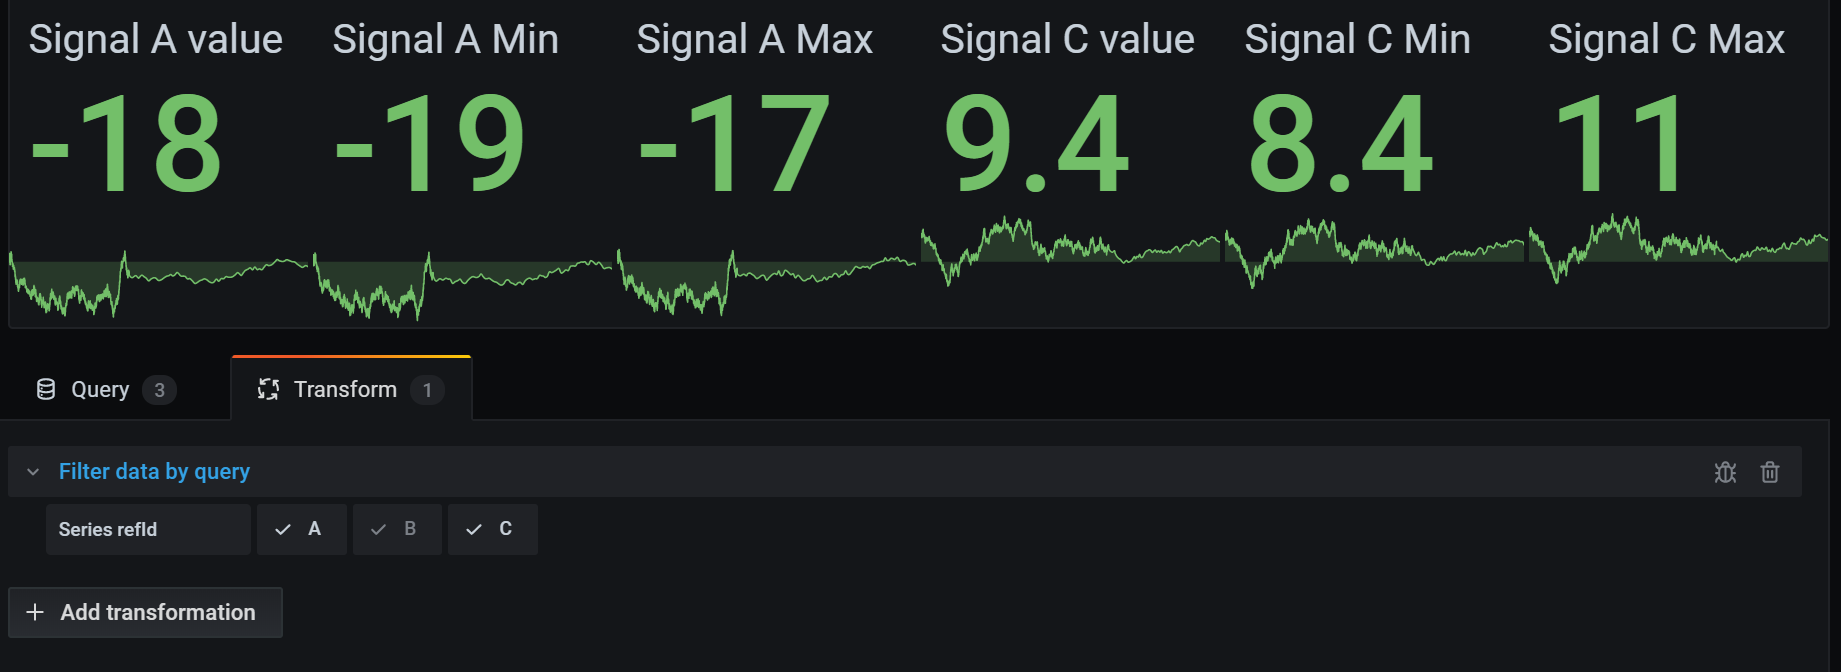
Grafana displays the query identification letters in dark gray text. Click a query identifier to toggle filtering. If the query letter is white, then the results are displayed. If the query letter is dark, then the results are hidden.
In the example below, the panel has three queries (A, B, C). I removed the B query from the visualization.
Organize fields
Use this transformation to rename, reorder, or hide fields returned by the query.
Note: This transformation only works in panels with a single query. If your panel has multiple queries, then you must either apply an Outer join transformation or remove the extra queries.
Grafana displays a list of fields returned by the query. You can:
- Change field order by hovering your cursor over a field. The cursor turns into a hand and then you can drag the field to its new place.
- Hide or show a field by clicking the eye icon next to the field name.
- Rename fields by typing a new name in the Rename
box.
In the example below, I hid the value field and renamed Max and Min.

Join by field (outer join)
Use this transformation to join multiple time series from a result set by field.
This transformation is especially useful if you want to combine queries so that you can calculate results from the fields.
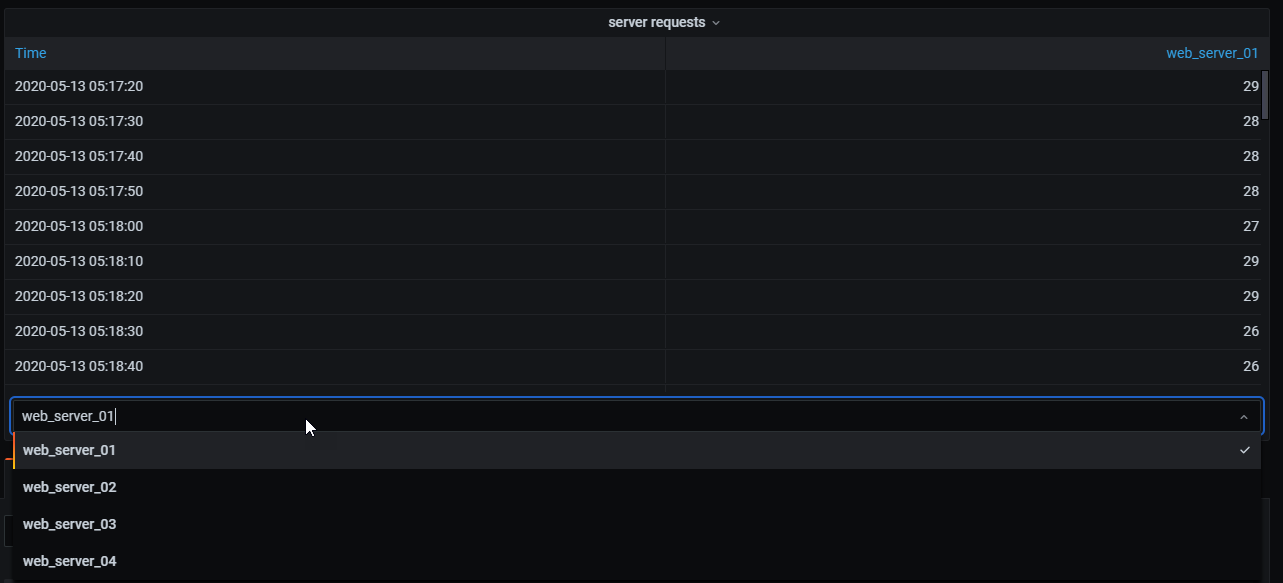
In the example below, I have a template query displaying time series data from multiple servers in a table visualization. I can only view the results of one query at a time.
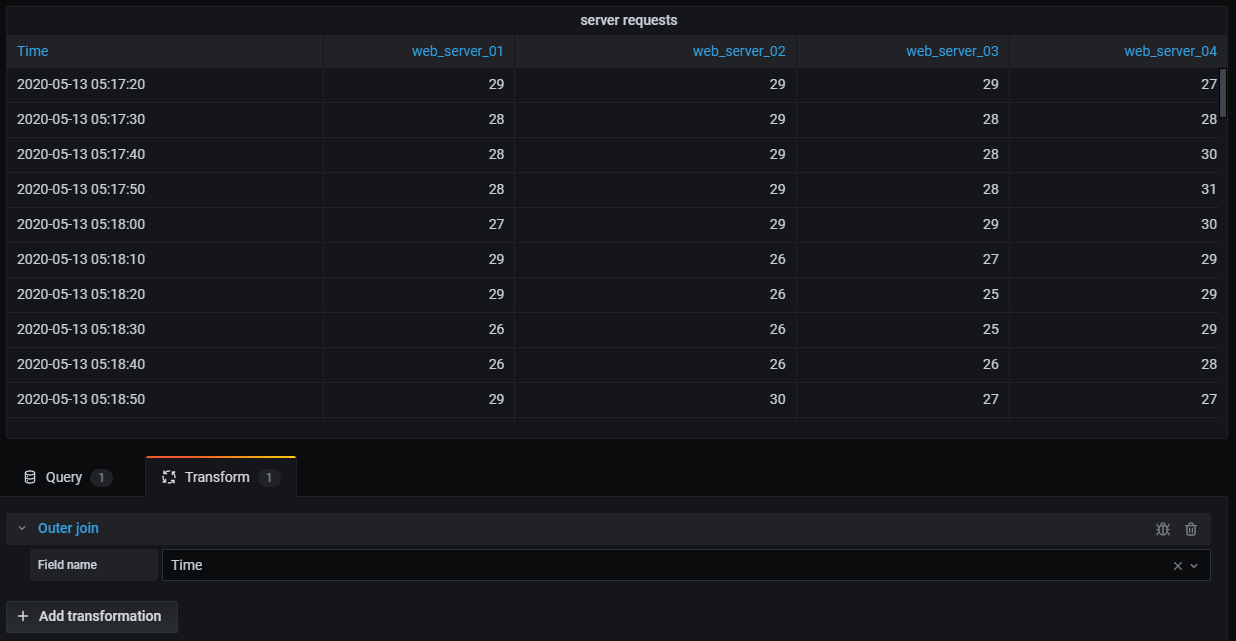
I applied a transformation to join the query results using the time field. Now I can run calculations, combine, and organize the results in this new table.
Add field from calculation
Use this transformation to add a new field calculated from two other fields. Each transformation allows you to add one new field.
- Mode - Select a mode:
- Reduce row - Apply selected calculation on each row of selected fields independently.
- Binary option - Apply basic math operation(sum, multiply, etc) on values in a single row from two selected fields.
- Field name - Select the names of fields you want to use in the calculation for the new field.
- Calculation - Select a calculation to use when Grafana creates the new field. Click in the field to see a list of calculation choices. For information about available calculations, refer to the Calculation list.
- Alias - (Optional) Enter the name of your new field. If you leave this blank, then the field will be named to match the calculation.
- Replace all fields - (Optional) Select this option if you want to hide all other fields and display only your calculated field in the visualization.
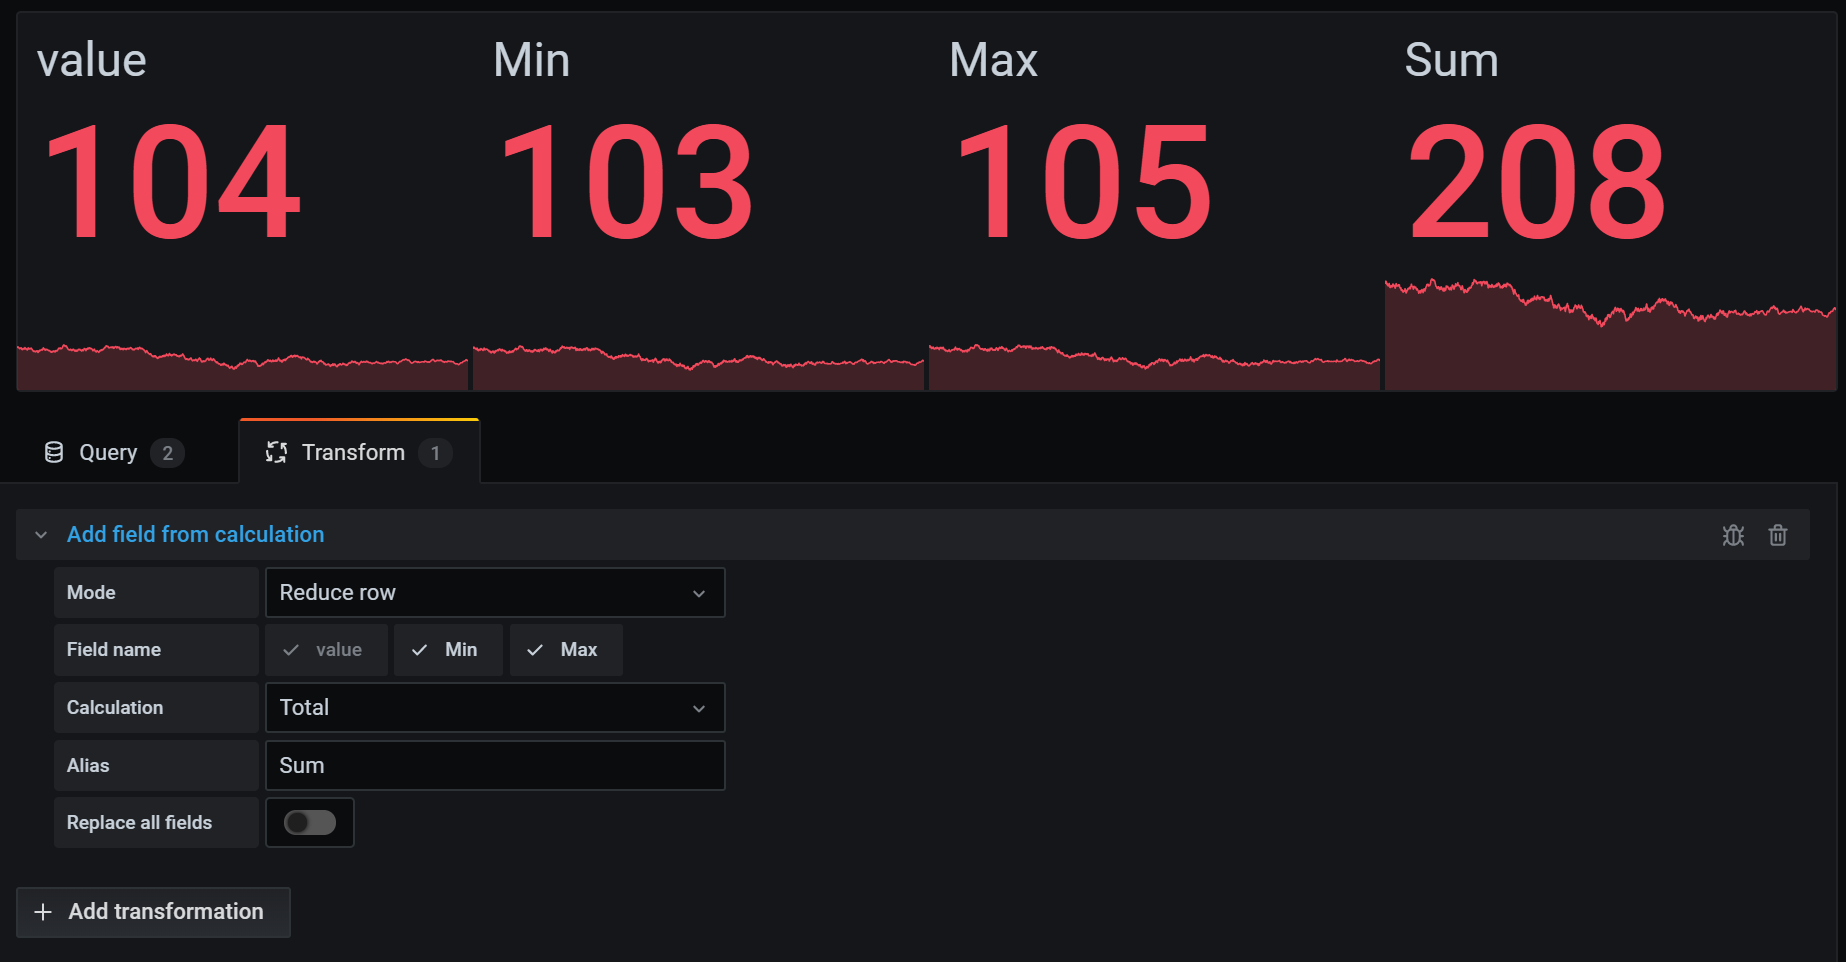
In the example below, I added two fields together and named them Sum.
Labels to fields
Use this transformation to group series by time and return labels or tags as fields.
Note: In order to apply this transformation, you must have a query to a data source that returns labeled fields.
When you select this transformation, Grafana automatically transforms all labeled data into fields.
For this example, I manually defined labels in the Random Walk visualization of TestData DB.

After I apply the transformation, my labels appear in the table as fields.

Series to rows
Note: This documentation refers to a Grafana 7.1 feature.
Use this transformation to combine the result from multiple time series data queries into one single result. This is helpful when using the table panel visualization.
The result from this transformation will contain three columns: Time, Metric, and Value. The Metric column is added so you easily can see from which query the metric originates from. Customize this value by defining Label on the source query.
In the example below, we have two queries returning time series data. It is visualized as two separate tables before applying the transformation.
Query A:
| Time | Temperature |
|---|---|
| 2020-07-07 11:34:20 | 25 |
| 2020-07-07 10:31:22 | 22 |
| 2020-07-07 09:30:05 | 19 |
Query B:
| Time | Humidity |
|---|---|
| 2020-07-07 11:34:20 | 24 |
| 2020-07-07 10:32:20 | 29 |
| 2020-07-07 09:30:57 | 33 |
Here is the result after applying the Series to rows transformation.
| Time | Metric | Value |
|---|---|---|
| 2020-07-07 11:34:20 | Temperature | 25 |
| 2020-07-07 11:34:20 | Humidity | 22 |
| 2020-07-07 10:32:20 | Humidity | 29 |
| 2020-07-07 10:31:22 | Temperature | 22 |
| 2020-07-07 09:30:57 | Humidity | 33 |
| 2020-07-07 09:30:05 | Temperature | 19 |
Debug transformations
To see the input and the output result sets of the transformation, click the bug icon on the right side of the transformation row.
Grafana displays the transformation debug view below the transformation row.
Was this page helpful?
Related resources from Grafana Labs


