

Prometheus 2020 year in review
It’s been a busy year in the world of Prometheus. Some of the 2020 highlights include a new agent; the addition of some great new features; new ways to reduce memory usage and have a faster restart time; and a fresh look at many old decisions and consensus positions.
New year, new observability data collector
Let’s start with something we rolled out in March: the release of the Grafana Agent, a lightweight subset of Prometheus and more, optimized for Grafana Cloud. It uses Prometheus upstream code, ensuring data integrity, staleness handling, and other properties the Prometheus ecosystem relies upon. Allowing a more flexible approach to where and how you scrape and transmit your data, it has become a favorite way to get data into storage backends. Through remote_write, it can push data into compatible storage endpoints to e.g. store data in Cortex directly. It also embeds a lot of exporters directly. While the Prometheus operating model of having many small integrations and exporters is, and remains, the most flexible way to emit data from a cloud native deployment, there are valid design trade-offs that mandate a single binary encompassing many exporters at once. In particular, organization structure, network security, and compliance requirements can make it preferable to have one multi-purpose and the agent covers just that. Plus, it embeds Promtail and OpenTelemetry tracing for cloud native logs and traces.
Just how good is it? Thanks to trimming down to the parts only needed for interaction with Cortex, tests of our first release showed up to a 40% memory-usage reduction compared to an equivalent Prometheus remote-write setup.
You can use the Grafana Agent with any platform that supports the Prometheus remote_write API. And I know of several users who prefer to use the Grafana Agent to send data to backends outside of the Prometheus family.
More improvements
In June, we released Prometheus v2.19.0. The highlight was the new feature of memory-mapping full chunks of the head (in-memory) block from disk, which reduces memory usage and also makes restarts faster. We saw 20 to 40% reduction in memory usage for that release alone.
Here are a couple of graphs that show what that looks like:
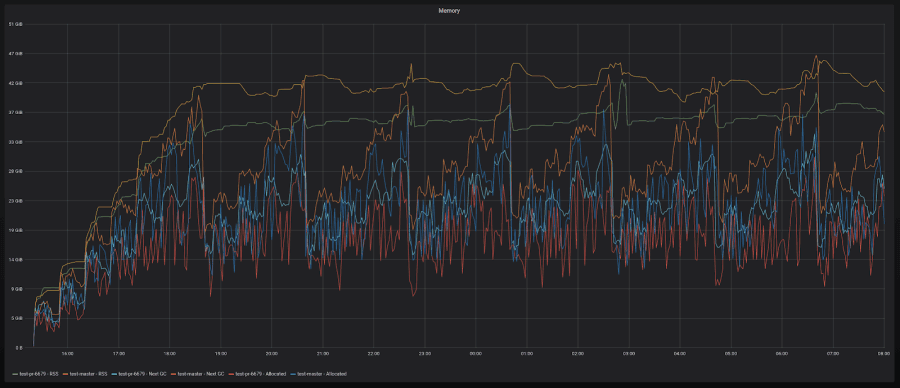
10-20% reduction with high-churn series
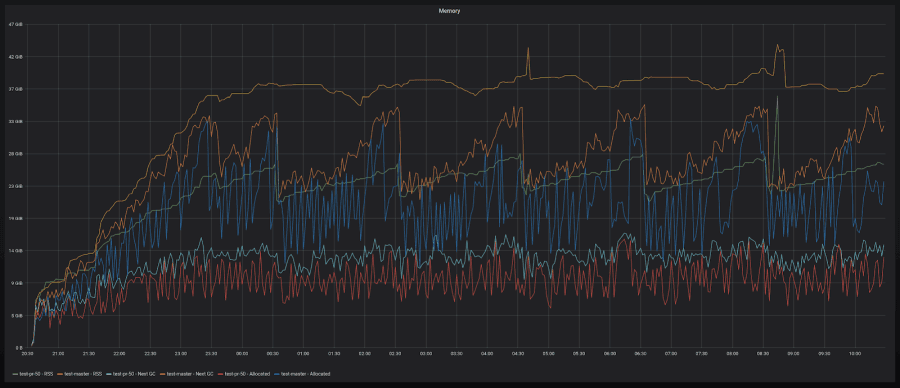
30-40% reduction with low-churn series
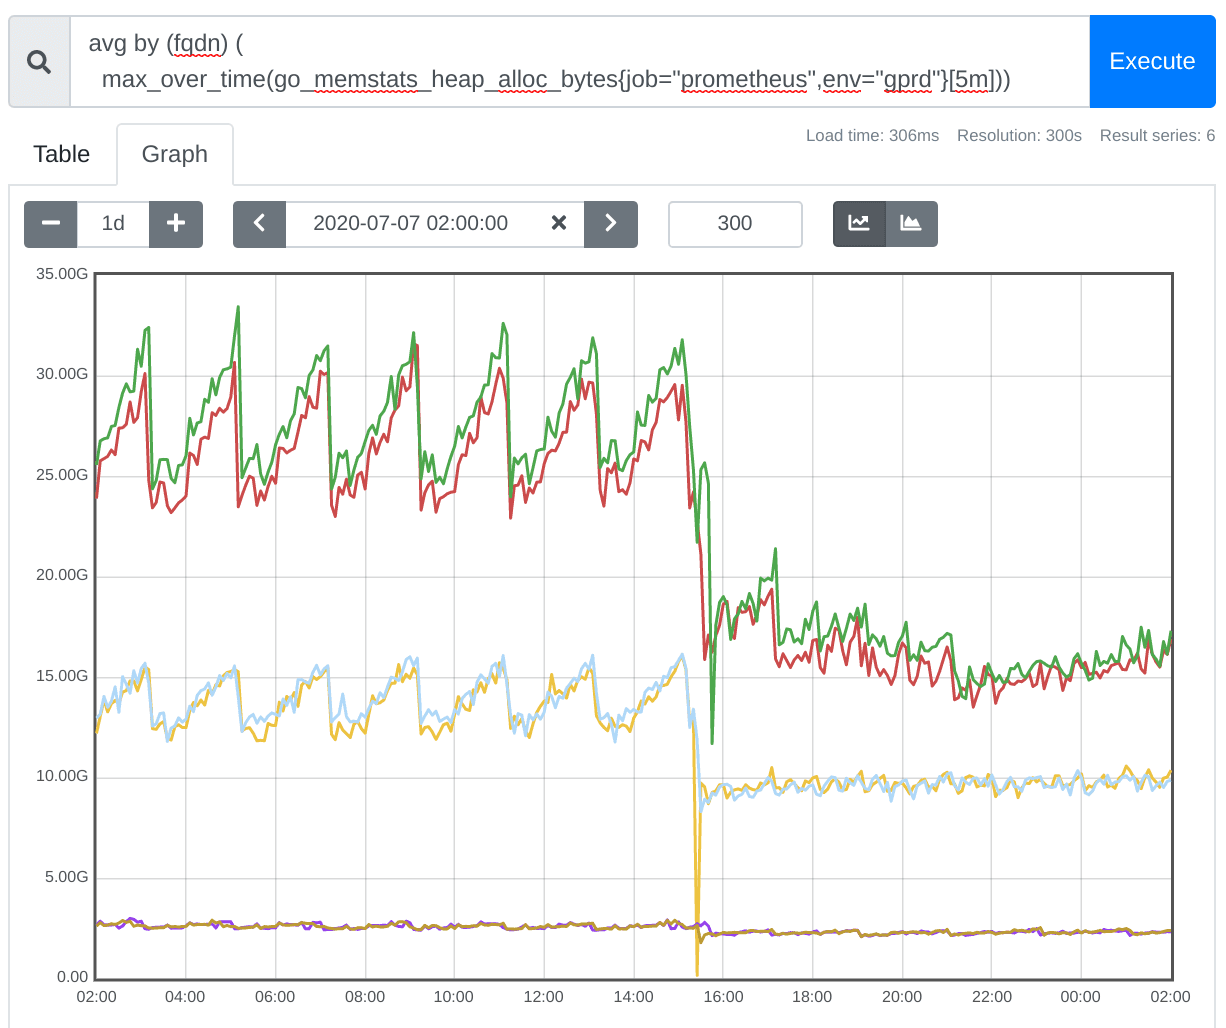
Prometheus is already efficient—especially in terms of its data integrity features—but it still has more optimization potential. In this example, Prometheus 2.19 reduced memory footprint by 50%:
Prometheus v.2.20 had the longest changelog of any release since 2.6(!). It features our native service discovery for Docker Swarm and DigitalOcean.
Productive summits
At around the same time, we started looking at a few long-held design decisions again. As users find more and more ways and fields to leverage Prometheus, their needs also become different and we want to meet them. As part of this effort, we increased the cadence of our dev summits. We had five dev summits in the last six months, and tackled quite a few large topics, which are outlined in these meeting notes:
Backfill in the forefront
Throughout the year, we’ve been working on improving backfill methods to get older data into Prometheus, which was the subject of a talk Goutham Veeramachaneni co-presented at KubeCon + CloudNativeCon EU in August.
Currently, there are two kinds of work-in-progress backfill implementations: recording rules and a simple bulk import. Recording rules are used heavily in Prometheus and are one of the most popular features, but they have only been forward-looking: creating new data from the data that comes in. The improvement will allow you to retroactively apply rules so your dashboards, alerts, and expensive queries run more quickly.
Our CommunityBridge mentee Jessica Greben came up with a way to fix the issue, which can be found in this design doc and open WIP PR. The idea is to add a command to promtool in the form of promtool backfill rules, allowing you to specify the recording rules and the time range you want to backfill for. This also ensures Prometheus itself is not slowed down, so it will never impact your alerting.
Simple bulk imports were a discussion topic in the Prometheus dev summit in July, and we decided to add CSV and OpenMetrics as the formats to be supported.
Exciting launch
September rolled around and it was time for another big announcement for Grafana Labs: the launch of Grafana Enterprise Metrics, a scalable Prometheus-compatible service designed for large organizations that is seamless to use and simple to maintain. Grafana Enterprise Metrics was built on Cortex, and extends those capabilities to provide customers with a centralized, horizontally scalable, replicated architecture so they can focus on using Prometheus-style metrics, not just on operating.
It’s the first of its kind: a Prometheus-as-a-Service solution designed for large enterprises. Other than operations, their pain point is usually query performance across huge datasets, and Cortex and GME solve this problem.
Full circle
We started this year on an agent, and we will close it on an agent. Just last Thursday, the Prometheus team decided to accept a donation of the Grafana Agent code as the basis for a highly reliable Prometheus agent, while retaining all properties of what makes Prometheus-compatible metrics, well, compatible with Prometheus. This will enable a wider ecosystem to collaborate on a standard agent with known properties.
And that’s just the basis for what’s to come in 2021. ;)
PROMETHEUS RESOURCES
TALKS & WEBINARS
KubeCon + CloudNativeCon EU: We’re making Prometheus use less memory and restart faster
KubeCon + CloudNativeCon EU: What you need to know about OpenMetrics
KubeCon + CloudNativeCon EU: Better histograms for Prometheus
PromCon Online: The future of Prometheus and its ecosystem
GrafanaCONline 2020: Prometheus rate queries in Grafana
How histograms changed the game for monitoring time series with Prometheus
GopherCon UK: Lock-free Observations for Prometheus Histograms
PromCon EU 2020: ‘Fixing’ Remote Write
ObservabilityCON: The evolution of Prometheus observability
ObservabilityCON: ConProf: Production-grade Prometheus for continuous profiling
ObservabilityCON: Always-enabled monitoring with Loki, Prometheus, and Grafana
BLOG POSTS
Best practices for meta-monitoring the Grafana Agent
Quick tip: How Prometheus can make visualizing noisy data easier
Introducing Grafana Metrics Enterprise, a Prometheus-as-a-service solution for enterprise scale
Introducing Prometheus-style alerting for Grafana Cloud
How we’re improving backfill methods to get older data into Prometheus
How we’re using ‘dogfooding’ to serve up better alerting for Grafana Cloud
Getting started with the Grafana Agent, a remote_write-focused Prometheus agent
How to visualize Prometheus histograms in Grafana
How we made working with Prometheus easier with metric metadata in Grafana’s Explore view
How isolation improves queries in Prometheus 2.17
Introducing Grafana Agent, a remote_write-focused Prometheus agent that can save 40% on memory usage
Pro tip: How to monitor client certificate expirations with Prometheus
Step-by-step guide to setting up Prometheus Alertmanager with Slack, PagerDuty, and Gmail

