How isolation improves queries in Prometheus 2.17
There are instances in life when isolation is actually welcome.
One of those instances pertains to the I in the acronym ACID, which outlines the key properties necessary to maintain the integrity of transactions in a database. The time series database (TSDB) embedded in the Prometheus server has the C (consistency), the D (durability), and – somewhat debatable – the A (atomicity).
But up until and including Prometheus v2.16, it did not have the I (isolation). Lack of isolation in the Prometheus context means that a query running concurrently with a scrape could only see a fraction of the samples ingested in that scrape. It needs the right timing and the right kind of query to make it happen. And even if it does happen, the impact is often hard to notice.
But sometimes, this leads to really weird results. And since the reason is so hard to find and understand, it might hit you really badly if it hits you at all.
Most commonly the problem pertains to histograms. The histogram_quantile function goes through the buckets of a histogram, and if some of those buckets are from the current scrape and some from the previous one, it will be thrown off course quite badly.
As you might know from my previous blog post histograms are one of my favorite topics in the Prometheus universe. Therefore, I’m very excited that isolation was finally added to the Prometheus TSDB in version 2.17, which was released in March.
The background
All the groundwork, the theory behind it, and an initial implementation of isolation was done long ago by Prometheus team member Brian Brazil. He explained it all in the second half of his epic talk Staleness and Isolation in Prometheus 2.0 at PromCon 2017. I wholeheartedly recommend giving this video your undivided attention. It’s quite dense, but I couldn’t explain it any better.
The theory hasn’t really changed since then, but as you may have noticed, the isolation feature didn’t make it into v2.0. Somehow, the original pull request was forgotten. A year later, Goutham Veeramachaneni, another Prometheus team member and my colleague at Grafana Labs) picked it up as part of a university project. But the new PR shared its fate with the previous one.
In my quest for better histograms for Prometheus, I gave that PR a third life. In principle, it was not much work. I “only” had to adjust the code to what had changed in another two years of busy development, and I had to hunt down some bugs. But now it’s finally done, and the story has a happy ending.
But there is no such thing as a free lunch. Isolation comes with a certain cost in terms of slightly increased CPU usage, memory usage, and query latency. In most scenarios, you probably won’t notice any of these changes. However, when reports of huge performance regressions came in after the v2.17 release, my heart skipped a beat. Luckily, it came from a different issue, which was promptly fixed and released as v2.17.1.
The impact of isolation
It’s easy to try it out at home. With a simple setup, you can observe the effects of isolation (and the lack thereof).
First, you need a test target to scrape. If you have a working Go development environment, you can just run an example from prometheus/client_golang:
$ GO111MODULE=on go get github.com/prometheus/client_golang/examples/random@v1.5.1
$ random
You can check the metrics output of the example target in your browser (or with curl) using the URL http://localhost:8080/metrics.
Now you need a Prometheus configuration file to scrape the test target. We actually do it five times in parallel to make it more likely to run into problems with isolation. Put the following in a file called prometheus.yml:
global:
  scrape_interval:     101ms
  evaluation_interval: 11ms

rule_files:
  - "demo-rules.yml"

scrape_configs:
  - job_name: 'example1'
    static_configs:
      - targets: ['localhost:8080']
  - job_name: 'example2'
    static_configs:
      - targets: ['localhost:8080']
  - job_name: 'example3'
    static_configs:
      - targets: ['localhost:8080']
  - job_name: 'example4'
    static_configs:
      - targets: ['localhost:8080']
  - job_name: 'example5'
    static_configs:
      - targets: ['localhost:8080']
Note the somewhat weird scrape_interval and evaluation_interval . Those numbers are crafted, again, to make it more likely to run into an isolation problem. Essentially, they make rule evaluations happen very frequently and at various phases of the scrape cycle. Also, the config refers to a rule file demo-rules.yml. Create it with the following content:
groups:
- name: demo
  rules:
  - record: this_should_not_happen
    expr: |2
        irate(rpc_durations_histogram_seconds_bucket{le="-8.999999999999979e-05"}[1s])
      > ignoring (le)
        irate(rpc_durations_histogram_seconds_bucket{le="1.0000000000000216e-05"}[1s])
This rule checks two buckets in the histogram exposed by the example target. If the bucket for shorter durations has a higher count than the bucket for longer durations, we have run into something that should never happen. (Remember: Prometheus histograms are cumulative.) The putative reason: Because of the lack of isolation, the rule evaluation saw a newer version of the bucket for shorter durations and compared it to an older version of the bucket for longer durations.
You can test it out by running the last Prometheus version without isolation implemented, which is v2.16.0. Run that version of the Prometheus server with the files created as described above in your preferred way. It’s particularly easy with Docker:
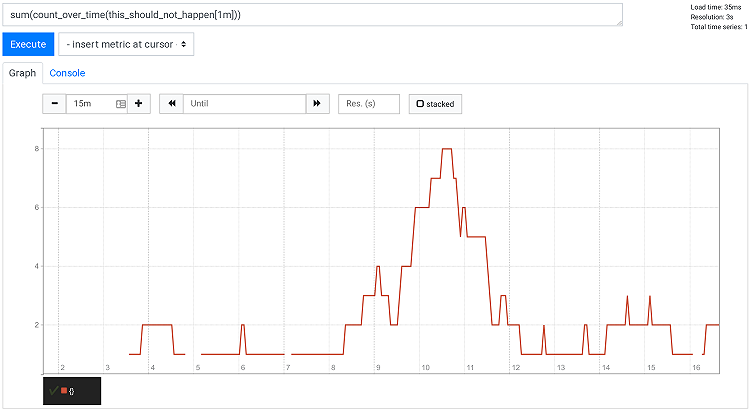
$ docker run --net=host -v $(pwd):/etc/prometheus prom/prometheus:v2.16.0Let it run for a few minutes, and then execute the query sum(count_over_time(this_should_not_happen[1m])) in a Graph tab of the built-in expression browser. You’ll see something like the following:

The query counts the number of times per minute the evaluation of this_should_not_happen created a result.
Now let’s pull out v2.17 and try the same thing again:
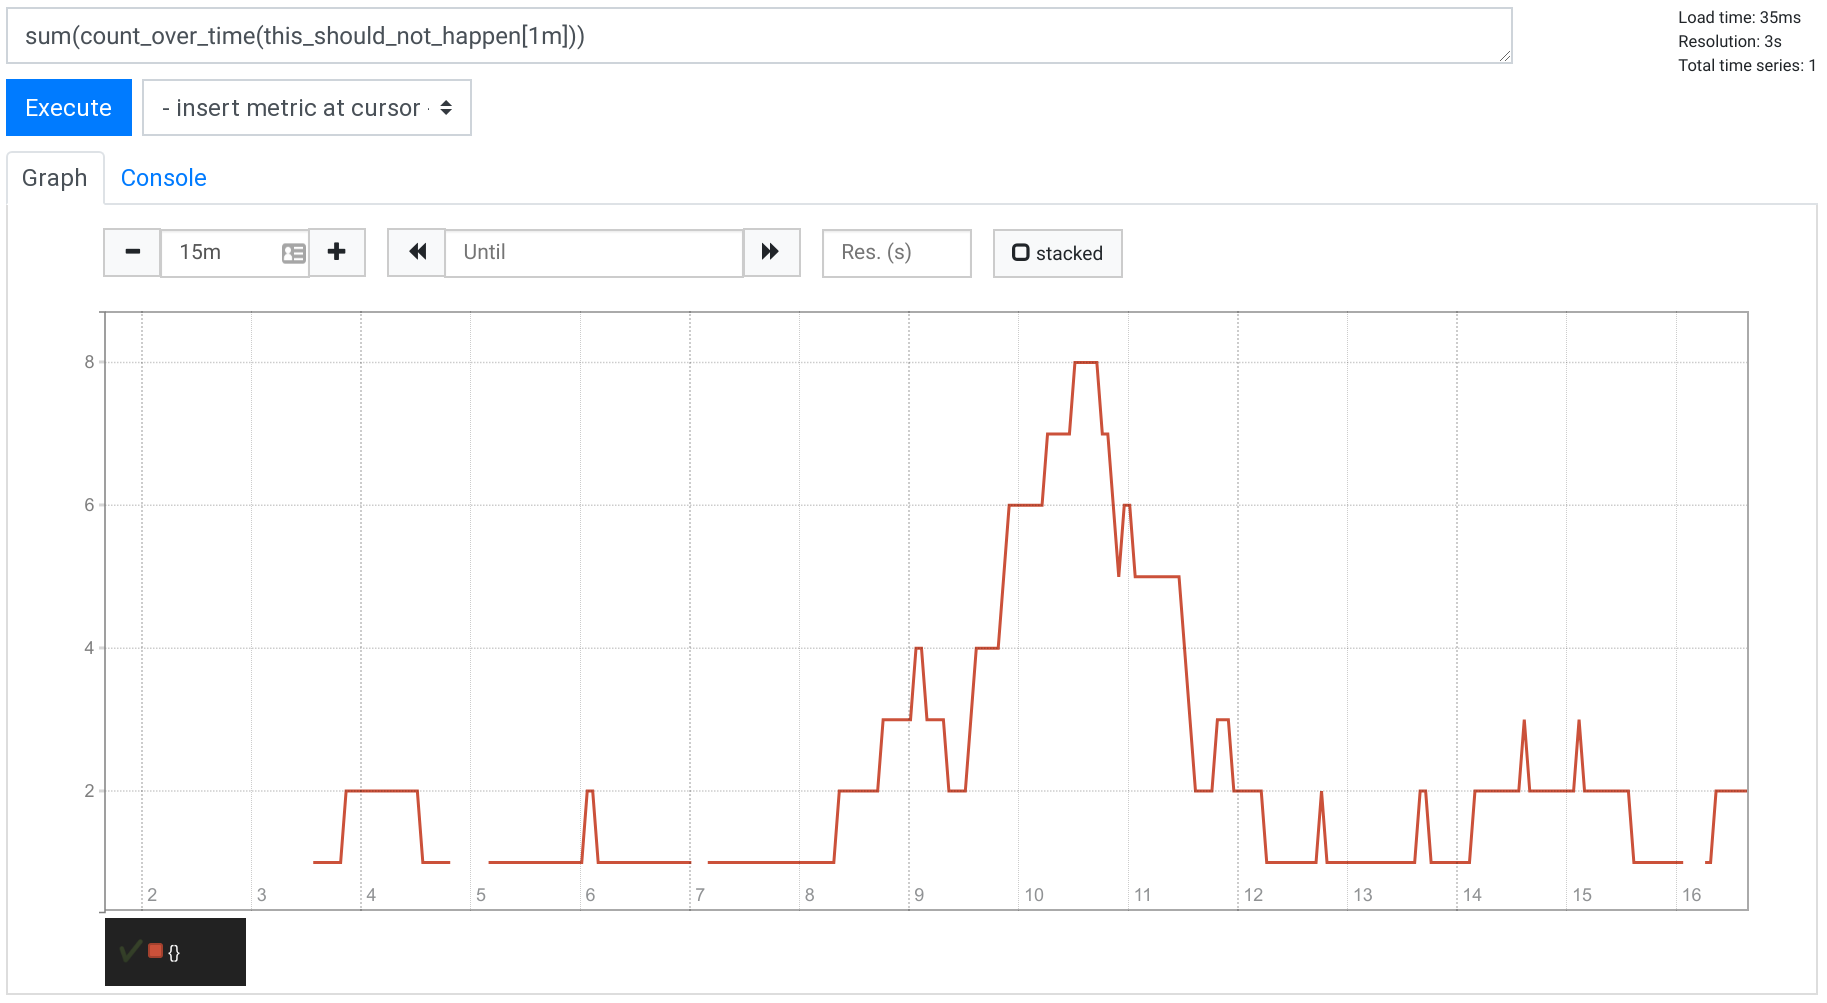
$ docker run --net=host -v $(pwd):/etc/prometheus prom/prometheus:v2.17.2Let it run for as long as you want. The result of the same query as above will always be the following:

What should not happen, doesn’t happen anymore. Mission accomplished!
