How histograms changed the game for monitoring time series with Prometheus
Histograms are one of my favorite topics in the Prometheus universe. Last November, I delivered a talk at PromCon EU 2019 that was titled Prometheus Histograms – Past, Present, and Future.
Only the part about the past had to be cut due to time constraints. But I made a promise to resurrect my talk about the history of histograms and I kept my word.
In February, I premiered the Secret History of Prometheus Histograms at FOSDEM 2020.
Following the many examples of movie trilogies in popular culture, I positioned this talk as a prequel to my original PromCon EU presentation. The PromCon talk covers the important topic of what the Prometheus histograms can do well today and where there is still work to be done.
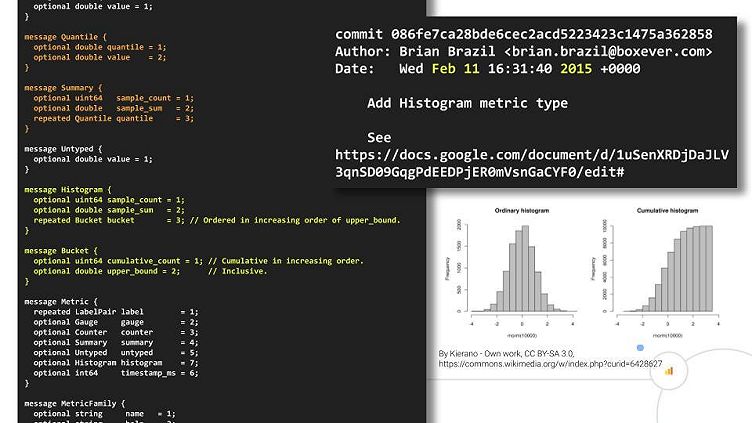
The prequel talk at FOSDEM describes how we got there and why. It’s an interesting archaeological dig into the Git log of the Prometheus open-source project, touching on not only how it started back in 2013 with its well-known counters and gauges. The presentation also covers how early versions of Prometheus offered summaries with precalculated quantiles to represent distributions.
But for precalculated quantiles, certain parameters have to be set during code instrumentation. They cannot be changed in hindsight. Even worse, precalculated quantiles cannot be aggregated later along the dimensions of your choice. Thus, summaries could not deliver on the first proverb from my Prometheus proverb collection: “Instrument first, ask questions later.”
The introduction of histograms in 2015 solved a lot of those problems, but not all of them. The remaining issues were left there “by design." In other words, they are inherent to the way we designed histograms. (Those problems and possible future solutions to them are covered in the PromCon EU talk.)
The FOSDEM talk, however, highlights another set of problems – those that were created by historical design decisions somewhere else in the Prometheus universe that affected histograms in an indirect way. It’s reminiscent of a Shakespearean tragedy: These design decisions were so problematic for histograms, yet, on the other hand, they contributed substantially to the huge success and progress of Prometheus. Enter the seductively simple text format, the celebrated improvements of the Prometheus v2 release, and, last but not least, the standardization efforts of a Prometheus-like exposition format by the OpenMetrics project.
I hope you enjoy watching the talk, even with its tragic undertones. But I won’t leave you without a silver lining: I’m actively working on better histograms for Prometheus, which is precisely the title of my talk planned for KubeCon + CloudNativeCon Europe 2020. Because of the current COVID-19 pandemic that is forcing many companies to restrict employees to work from home, the conference is currently postponed until August. But that only means I’ll be able to present even more results from my research. Stay tuned for Episode III of the histogram trilogy!
For more from Grafana Labs at FOSDEM 2020, check out our talks on how Tanka, Grafana Labs’ new jsonnet-based project, improves Kubernetes usage and learn how to configure Grafana as code.
