![[KubeCon + CloudNativeCon EU recap] Better histograms for Prometheus](/static/assets/img/blog/kubeconeuprometheushistograms1.png?w=752)
[KubeCon + CloudNativeCon EU recap] Better histograms for Prometheus

It’s only four months ago that I blogged about histograms in Prometheus. Back then, I teased my talk planned for (virtual) KubeCon Europe 2020. On Aug. 20, the talk finally happened. It completed the trilogy of histogram talks also mentioned in my previous blog post. Here is the recommended viewing order:
- Secret History of Prometheus Histograms. FOSDEM, Brussels, Belgium.
- Prometheus Histograms – Past, Present, and Future. PromCon, Munich, Germany.
- Better Histograms For Prometheus. KubeCon EU, online, anywhere.
This talk is about a hopefully bright future for Prometheus histograms, in which the current problems that many of us know only too well will have all been solved. I have conducted some serious research based on real production data from the Grafana Labs Cortex clusters to come up with a plan for better histograms. I’m currently working on a clean write-up of my proposal to be presented to the Prometheus community for further discussion. In the meantime, you can watch my KubeCon talk on YouTube, or you can look at the GitHub repository where I have collected my results in rough form.
In the talk, I present a wish list of what we all want from the new histograms.

Can we really have all of them? Spoiler alert: The answer is “almost” for all the wishes except perhaps the last one, where more research is needed to see how efficient the implementation can get.
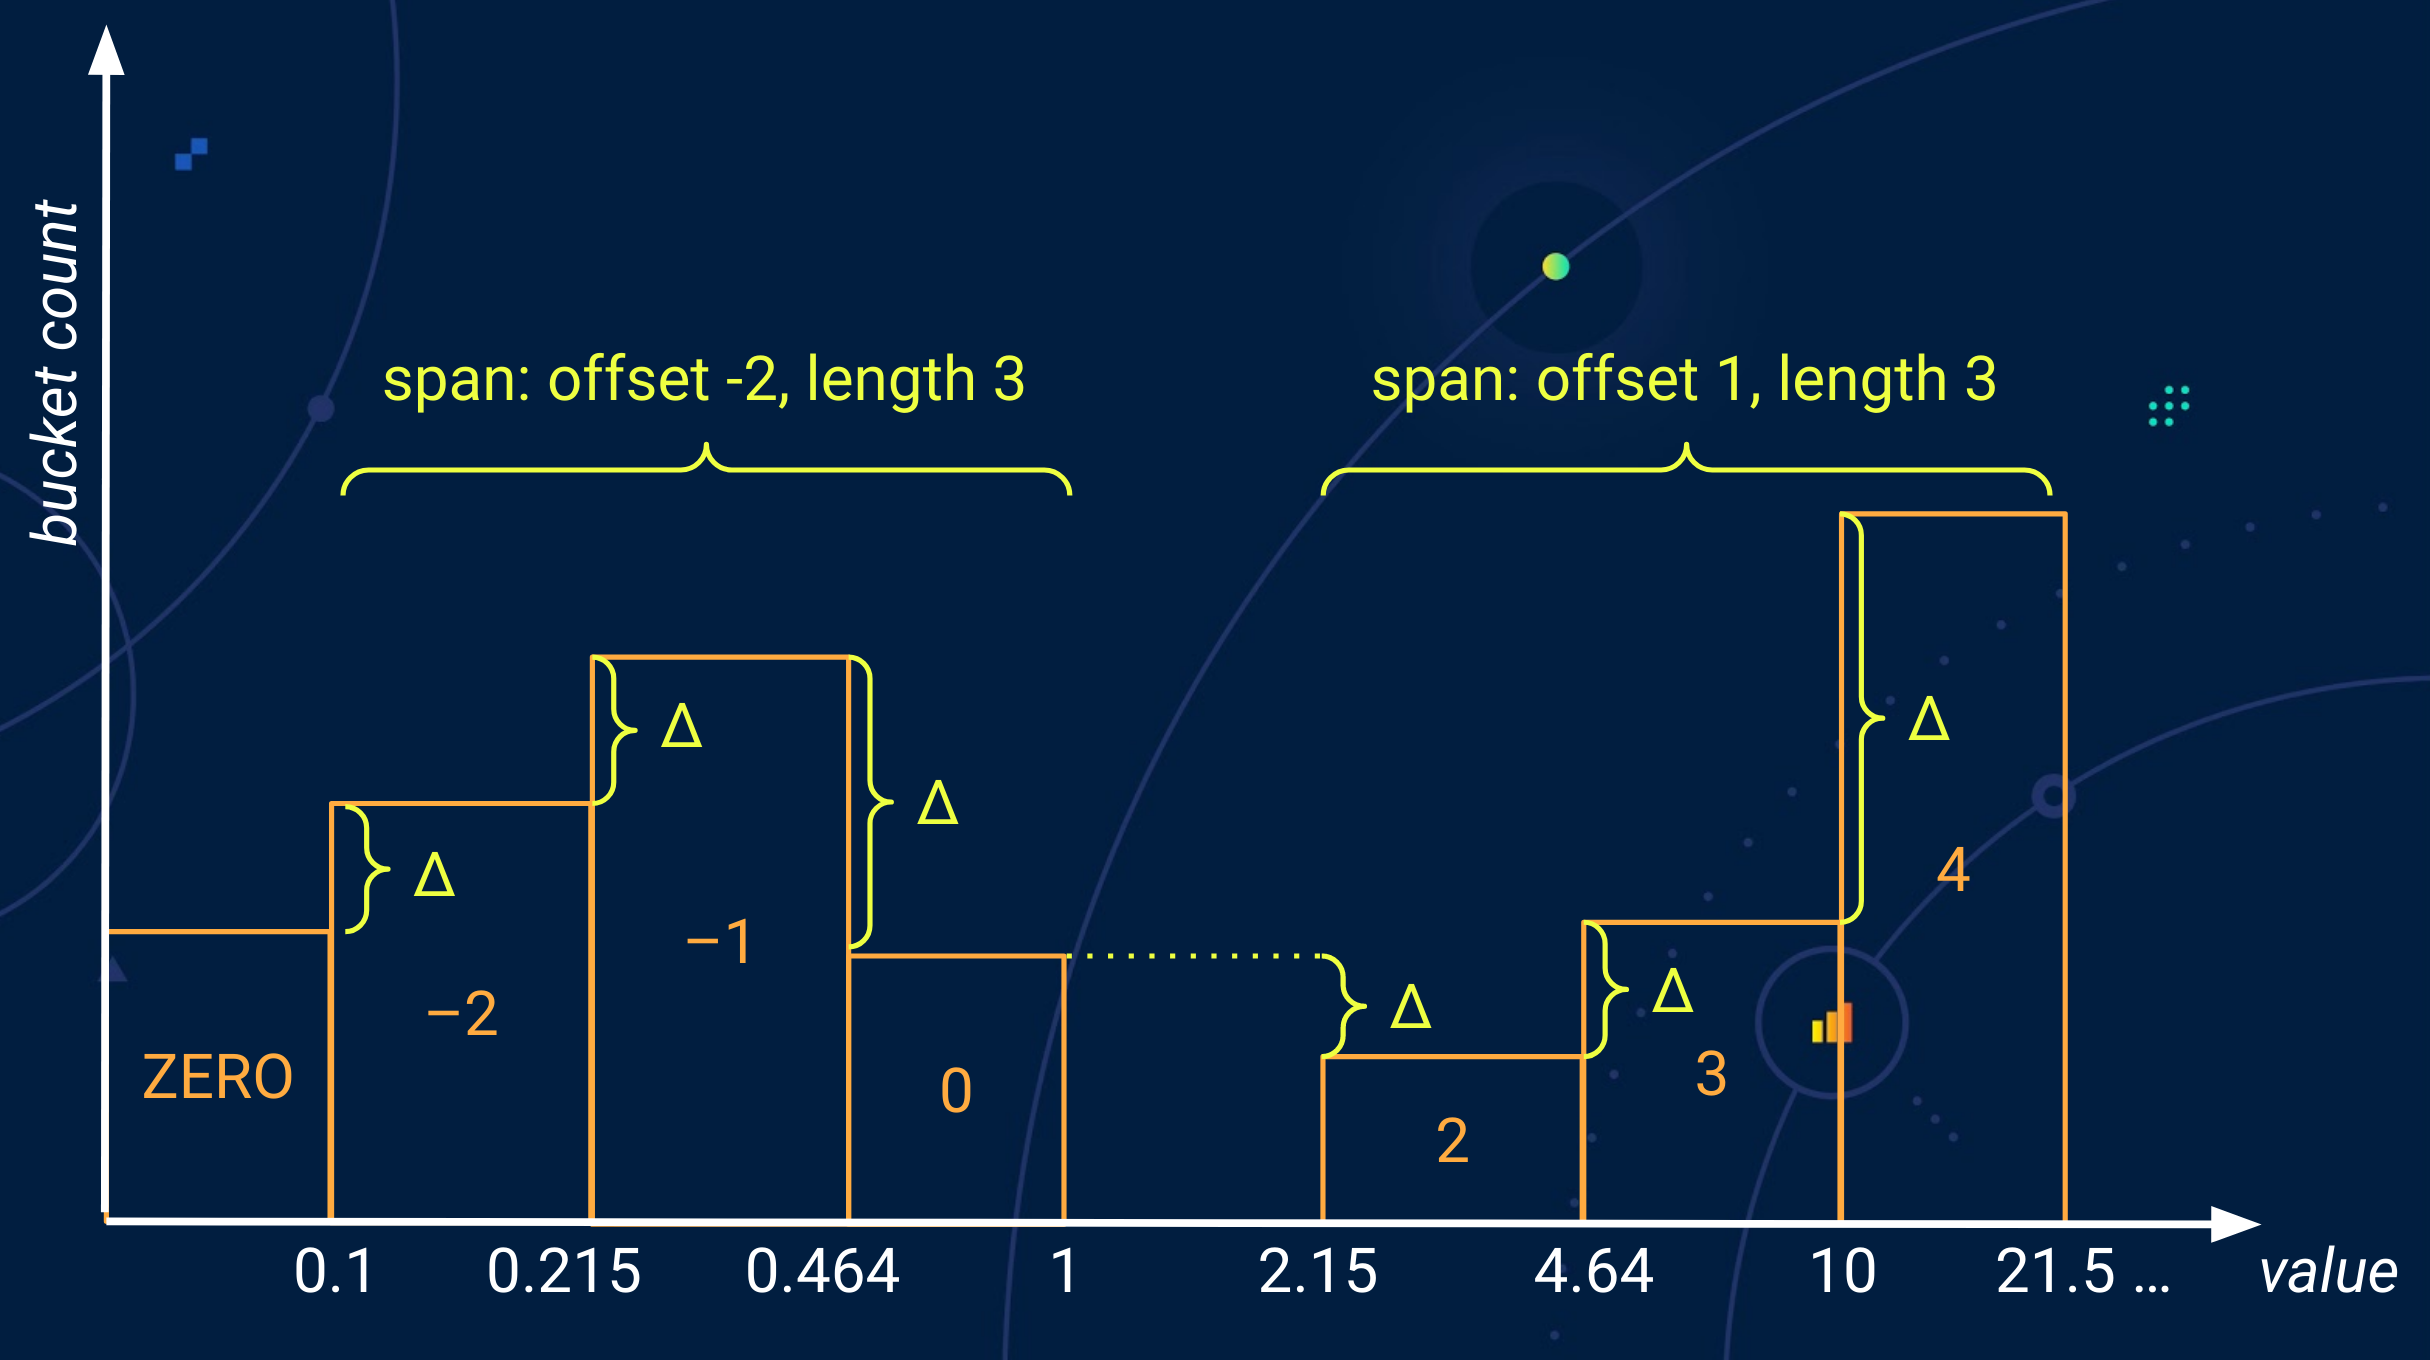
The basic idea is to have a histogram with an effectively infinite number of buckets, arranged in a regular logarithmic schema with a fairly high resolution. How can we deal with an infinite number of buckets, you might ask? The solution to that is efficient handling of sparseness, i.e. ensuring empty buckets don’t take up any resources. This idea is not new at all. In several variations, it has been used in other systems for quite some time. However, there are reasons to believe that this approach wouldn’t play well with the Prometheus model of collecting metrics data and evaluating metrics queries.
Thus, my first mission was to find out if those problems can be overcome. By now, I am quite confident that they can. In the next step, I created proof-of-concept implementations of the instrumentation part and how to encode the new histograms in the exposition format and in the time-series database inside Prometheus. Again, this is an area where I have gained a pretty high level of confidence that I am up to something that will work out.
How to query the new histograms in a meaningful way still needs to be fleshed out. And then there is the daunting question of how expensive storing and querying the histograms will be in the end.
Introducing the new sparse and high-resolution histograms will require changes throughout the whole Prometheus stack: From instrumentation over exposition and storage all the way to querying. However, I think it will be worth the effort. I am hopeful that the Prometheus community will soon have a plan for what we have to do to reach that goal.
Read more about Prometheus within the Grafana Labs community and learn more about all the Grafana Labs talks at KubeCon + CloudNativeCon EU here.
