New in Prometheus v2.19.0: Memory-mapping of full chunks of the head block reduces memory usage by as much as 40%
The just-released Prometheus v2.19.0 introduces the new feature of memory-mapping full chunks of the head (in-memory) block from disk, which reduces memory usage and also makes restarts faster. I will be talking about this feature in this blog post.
The memory-mapping
The head block is the in-memory part of the time series database (TSDB) embedded in Prometheus. It stores the last 1–3 hours of data in memory. The data is flushed to disk every 2 hours to form persistent blocks. In the head block, we store the samples in the form of compressed chunks; each chunk consists of up to 120 samples, and when we create a new chunk, the old one is said to be “full.”
A full chunk is not modified once a new chunk is cut for the series. We use this information to flush chunks to disk whenever they are full and only store references to the chunks (file index and offset in file) in memory. We memory-map the file on disk, which means the operating system loads the chunks into memory when needed. With this, depending on the scrape interval, the majority of the sample data stays on disk while the memory usage is reduced overall.
Benchmark results
In the benchmarks that we run on PRs on GitHub by deploying actual Prometheus instances, we saw 20–40% reduction in memory usage. The difference in reduction depends on the churn: With high churn, some of the series will never fill a chunk up to 120 samples and hence will take more memory throughout.
The maximum reduction is seen for short scrape intervals and low churn, as chunks get full more quickly. If you have a very long scrape interval, like 1 minute or more, you will see only a very minimal effect on memory consumption, as it takes longer to fill up a chunk.
As a side effect of memory-mapping chunks, during the replay of the Write Ahead Log (WAL) we can discard all samples within the time range that is already covered in the memory-mapped chunks. This showed a reduction of 20–30% replay time in the benchmark.
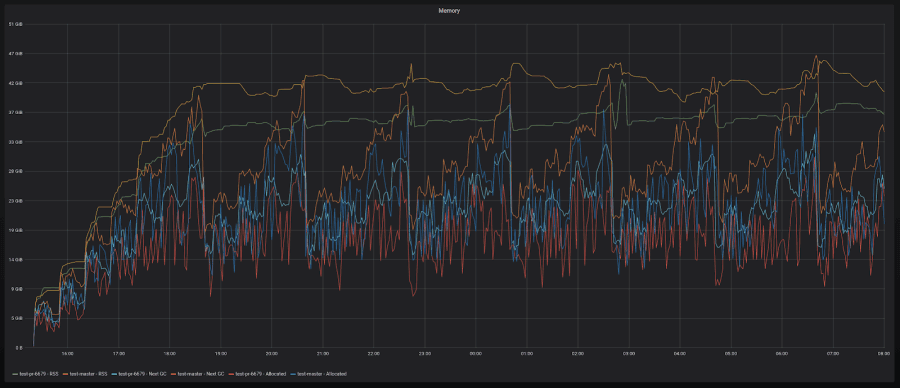
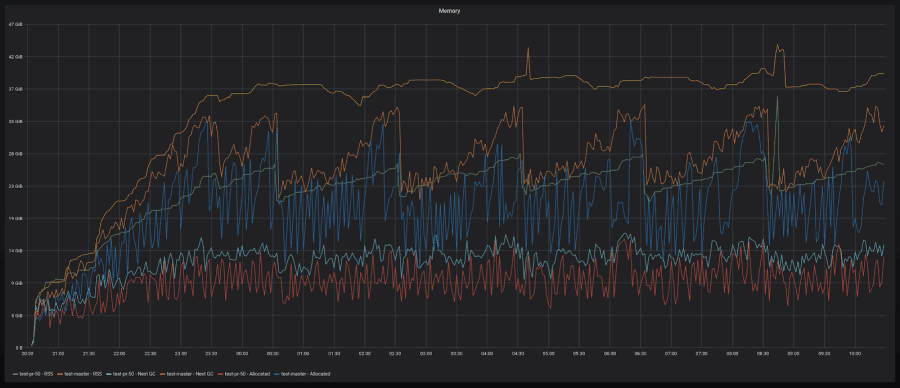
Here are some graphs:
Decent memory reduction with high churn (10-20%)
Massive memory reduction with little to no churn (30-40%)
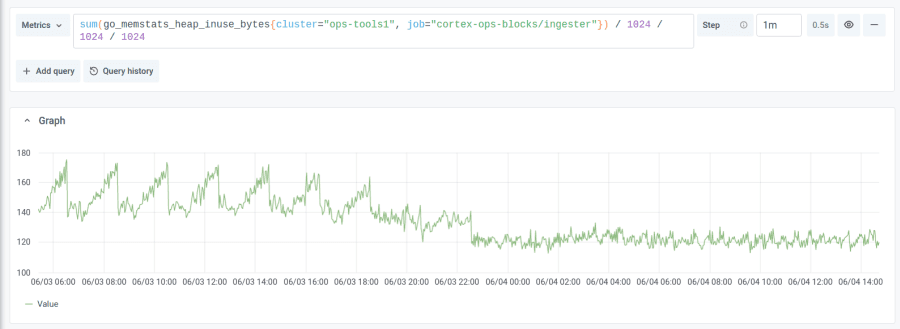
The improvements are not limited to Prometheus. Other projects in the Prometheus ecosystem like Cortex and Thanos, which import the Prometheus TSDB, also benefit from this change. Here is a graph from Cortex with block storage, where not only the memory usage is reduced, but so are the spikes in memory every 2 hours.
Some things to keep in mind
It is natural to assume that you can now reduce the resource allocation for Prometheus as it’s using less memory. But it cannot be ignored that the chunks are loaded into memory when required. So if you run heavy queries that would touch a lot of series simultaneously for the past few hours of data, then Prometheus is going to take up a little more memory than the ideal reduction. Plan the resources keeping this in mind.
Learn more about Prometheus
Here is the full changelog for Prometheus v2.19.0 and binaries along with it. Upgrade now to see memory-mapping of head chunks in action!
For more about what’s new in Prometheus, check out the on-demand recording of Goutham Veeramachaneni’s GrafanaCONline talk, Prometheus: What the future holds.