Quick tip: How Prometheus can make visualizing noisy data easier
Most of us have learned the hard way that it’s usually cheaper to fix something before it breaks and needs an expensive emergency repair. Because of that, I like to keep track of what’s happening in my house so I know as early as possible if something is wrong.
As part of that effort, I have a temperature sensor in my attic attached to a Raspberry Pi, which Prometheus scrapes every 15 seconds so I can view the data in Grafana. This way, I know how things look over time, and I can get alerts if my house is getting too hot or too cold.
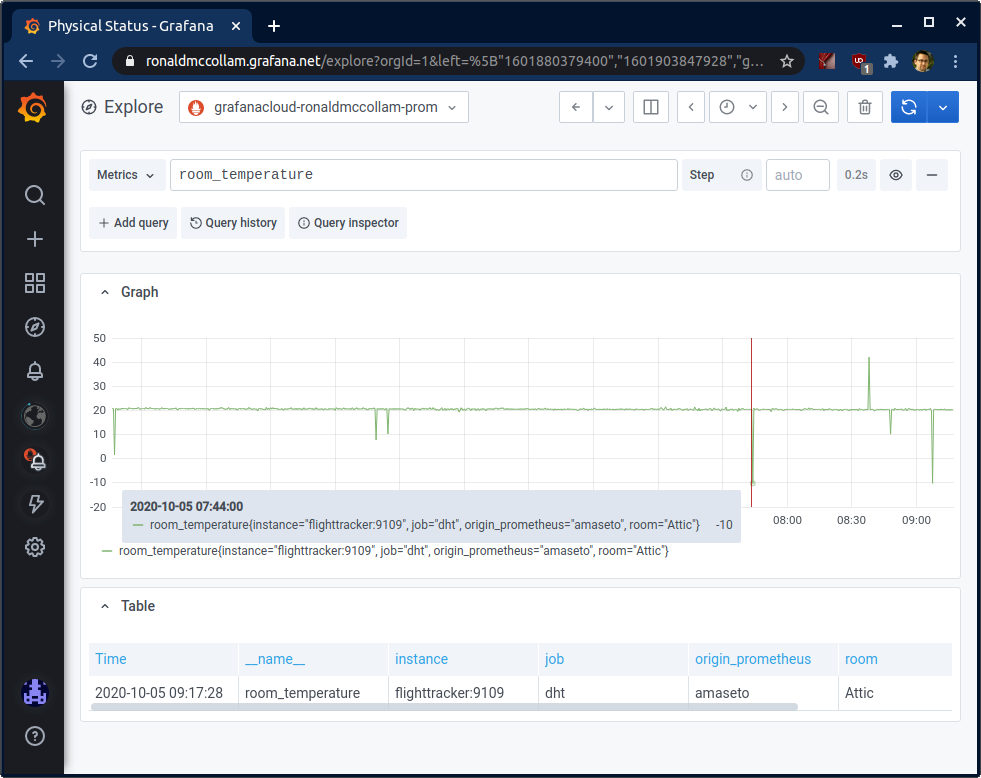
Unfortunately, my temperature sensor is a bit flaky. It works most of the time, but occasionally it gives me wildly inaccurate readings. Here’s an example that looks at a few hours of data:

Even though the weather can be unpredictable here in New England, it’s pretty unlikely that the room temperature dropped from 20°C to -10° for 15 seconds before returning to normal!
Still, other than these occasional single readings that are obviously wrong, most of the data looks good. So my first thought when I saw this glitch was to replace the sensor with one that works more consistently. After all, having good data helps with everything.
But I started to think about the problem more . . .
What would I do if I had a sensor like this that couldn’t easily be replaced? If my sensor were on top of a mountain or deep under the ocean, it would be difficult and expensive to fix. And if it were on a satellite or in a rover on Mars, it would be impossible.
I couldn’t help but wonder: If most of the data is good, is there a way to keep the good bits and throw out the bad?
After speaking with some data scientist friends, it turns out that the answer is yes. And even better, Prometheus has a function to do exactly that!
Working with quantiles
The key to making the data usable is quantiles, a statistical tool that enables you to break up a set of data based on frequency.
If you have evenly distributed data and you break it into quantiles, each one will have about the same number of points. But if your data is not evenly distributed, you can use quantiles to look for the most or least frequently occurring data points.
In my example, we should expect most of the points to be very similar to each other. (It’s unlikely that in the real world, temperature in an attic can swing by 30 degrees for 15 seconds before returning to baseline.) We definitely expect to see change, but it would be a gradual change over time.
There’s no way to look at a single data point without context and tell if it’s accurate and should be kept, or if it’s bad and should be thrown away. But by using quantiles, we can look at a set of data and see if one or two of the points are way outside the range of the others.
I have time series data, so what I can do is look at a few points before the current one in order to determine if any of those points is outside the norm.
The Prometheus solution
Prometheus has a function to do this called quantile_over_time, and just as its name suggests, it lets you create a quantile from a range of values over a time period. You need to provide two things: the quantile you’re interested in, and a range vector to analyze.
The quantile in this case is pretty easy: Since I expect the values over a short period of time to be very close to each other, I want to find values that are close to the median of all the values. That means I can use the .5 quantile, which provides the median. (Over larger, slower-moving data sets, I might want to increase that. I might even look at something like .95 to get the 95th percentile if I only see extremely rare anomalies over lots and lots of data.)
The time range is actually a bit trickier. I need it to contain enough data points to quantize meaningfully, but not go on so long that I lose resolution. Since I’ll be applying this analysis on a range vector, I’m always looking at a rolling window of data. Go too short – say two to three data points – and I won’t be able to tell which point is an outlier and which points are normal. But go too long – like 30 minutes – and I’ll lose the ability to quickly see changes. (And if a hole suddenly opens in my roof, I want to know as soon as possible!)
For my data, I went with a five minute window. I’m collecting data at 15s resolution which is four times per minute, so 5 minutes x 4 points per minute gives me 20 data points to look at. It’s enough to be able to see linear patterns and detect outliers, but not so much that I lose too much relevancy when looking at a short time period.
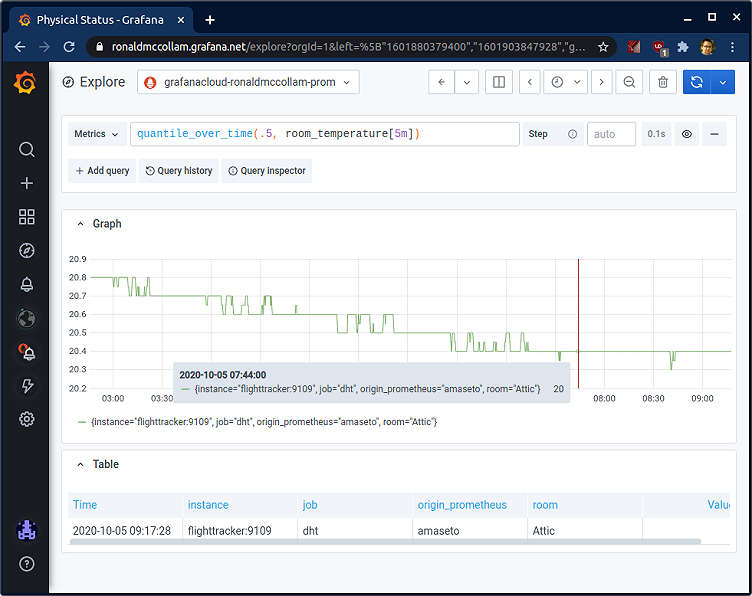
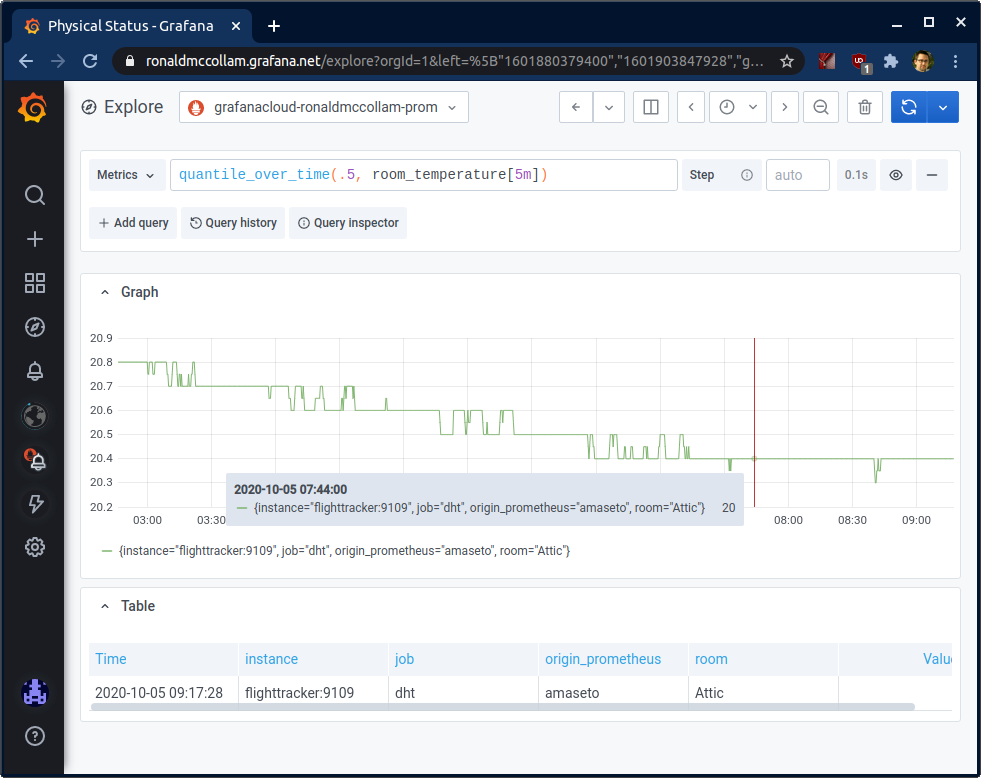
Once I applied this function, my graph looked much more reasonable. The same time period as before showed me the room temperature was 20°C instead of -10°:

The graph looks a bit more jagged here than before, but that’s actually a good thing! Previously, the outliers were so extreme that Grafana had to scale out to show the full graph. Here I’m able to see more detail because the changes are smaller.
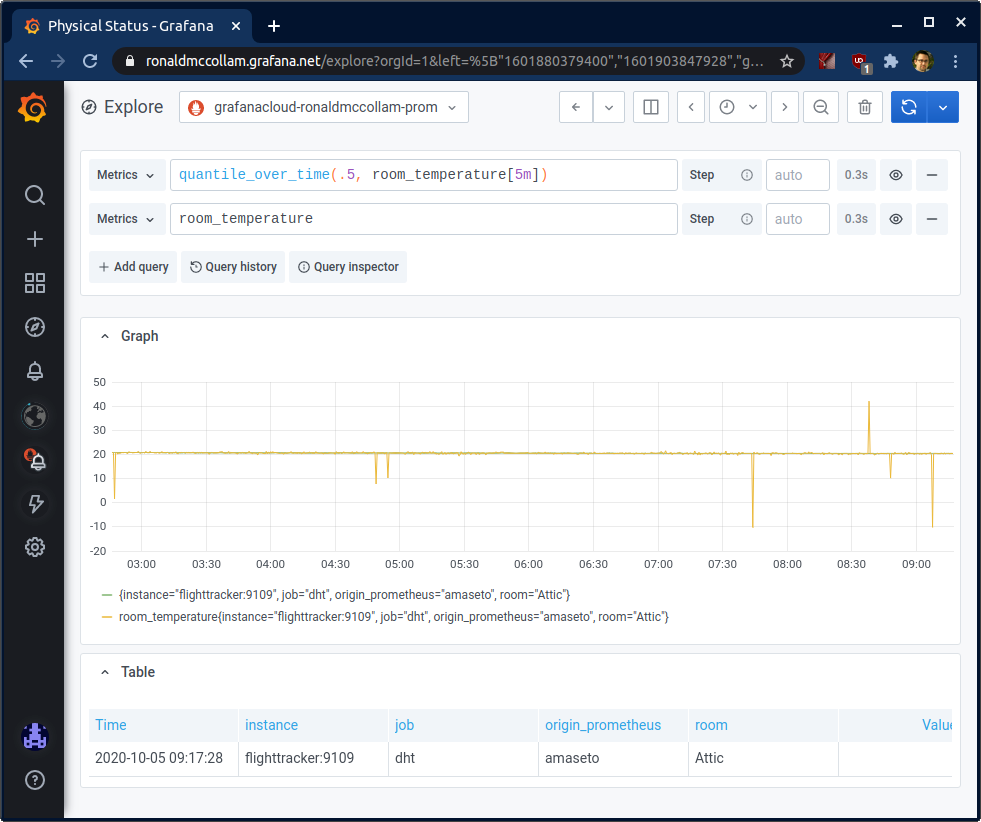
When overlaid together with the previous data, this becomes more obvious:

My quantized data lines up perfectly with the “real” values, but leaves out the spikes where my temperature sensor reported bad values.
Helpful reminder
Prometheus is well-known for being able to collect and query data, but keep in mind that it can also be the first step in analyzing data. When you see something unusual, don’t be afraid to pull up the Grafana “Explore” view and experiment with the statistical functions that are built into the platform. Chances are, with a bit of thought and some short PromQL, you’ll be able to get the view you need.
