Plugins 〉kubernetes


The kubernetes plugin has been deprecated and is no longer maintained.
kubernetes


Grafana App for Kubernetes
Kubernetes is an open-source system for automating deployment, scaling, and management of containerized applications.
The Grafana Kubernetes App allows you to monitor your Kubernetes cluster's performance. It includes 4 dashboards, Cluster, Node, Pod/Container and Deployment. It allows for the automatic deployment of the required Prometheus exporters and a default scrape config to use with your in cluster Prometheus deployment. The metrics collected are high-level cluster and node stats as well as lower level pod and container stats. Use the high-level metrics to alert on and the low-level metrics to troubleshoot.

Requirements
- Currently only has support for Prometheus
- For automatic deployment of the exporters, then Kubernetes 1.6 or higher is required.
- Grafana 5.0.0+
Features
The app uses Kubernetes tags to allow you to filter pod metrics. Kubernetes clusters tend to have a lot of pods and a lot of pod metrics. The Pod/Container dashboard leverages the pod tags so you can easily find the relevant pod or pods.
Easy installation of exporters, either a one click deploy from Grafana or detailed instructions to deploy them manually them with kubectl (also quite easy!)
Cluster level metrics that are not available in Heapster, like CPU Capacity vs CPU Usage.
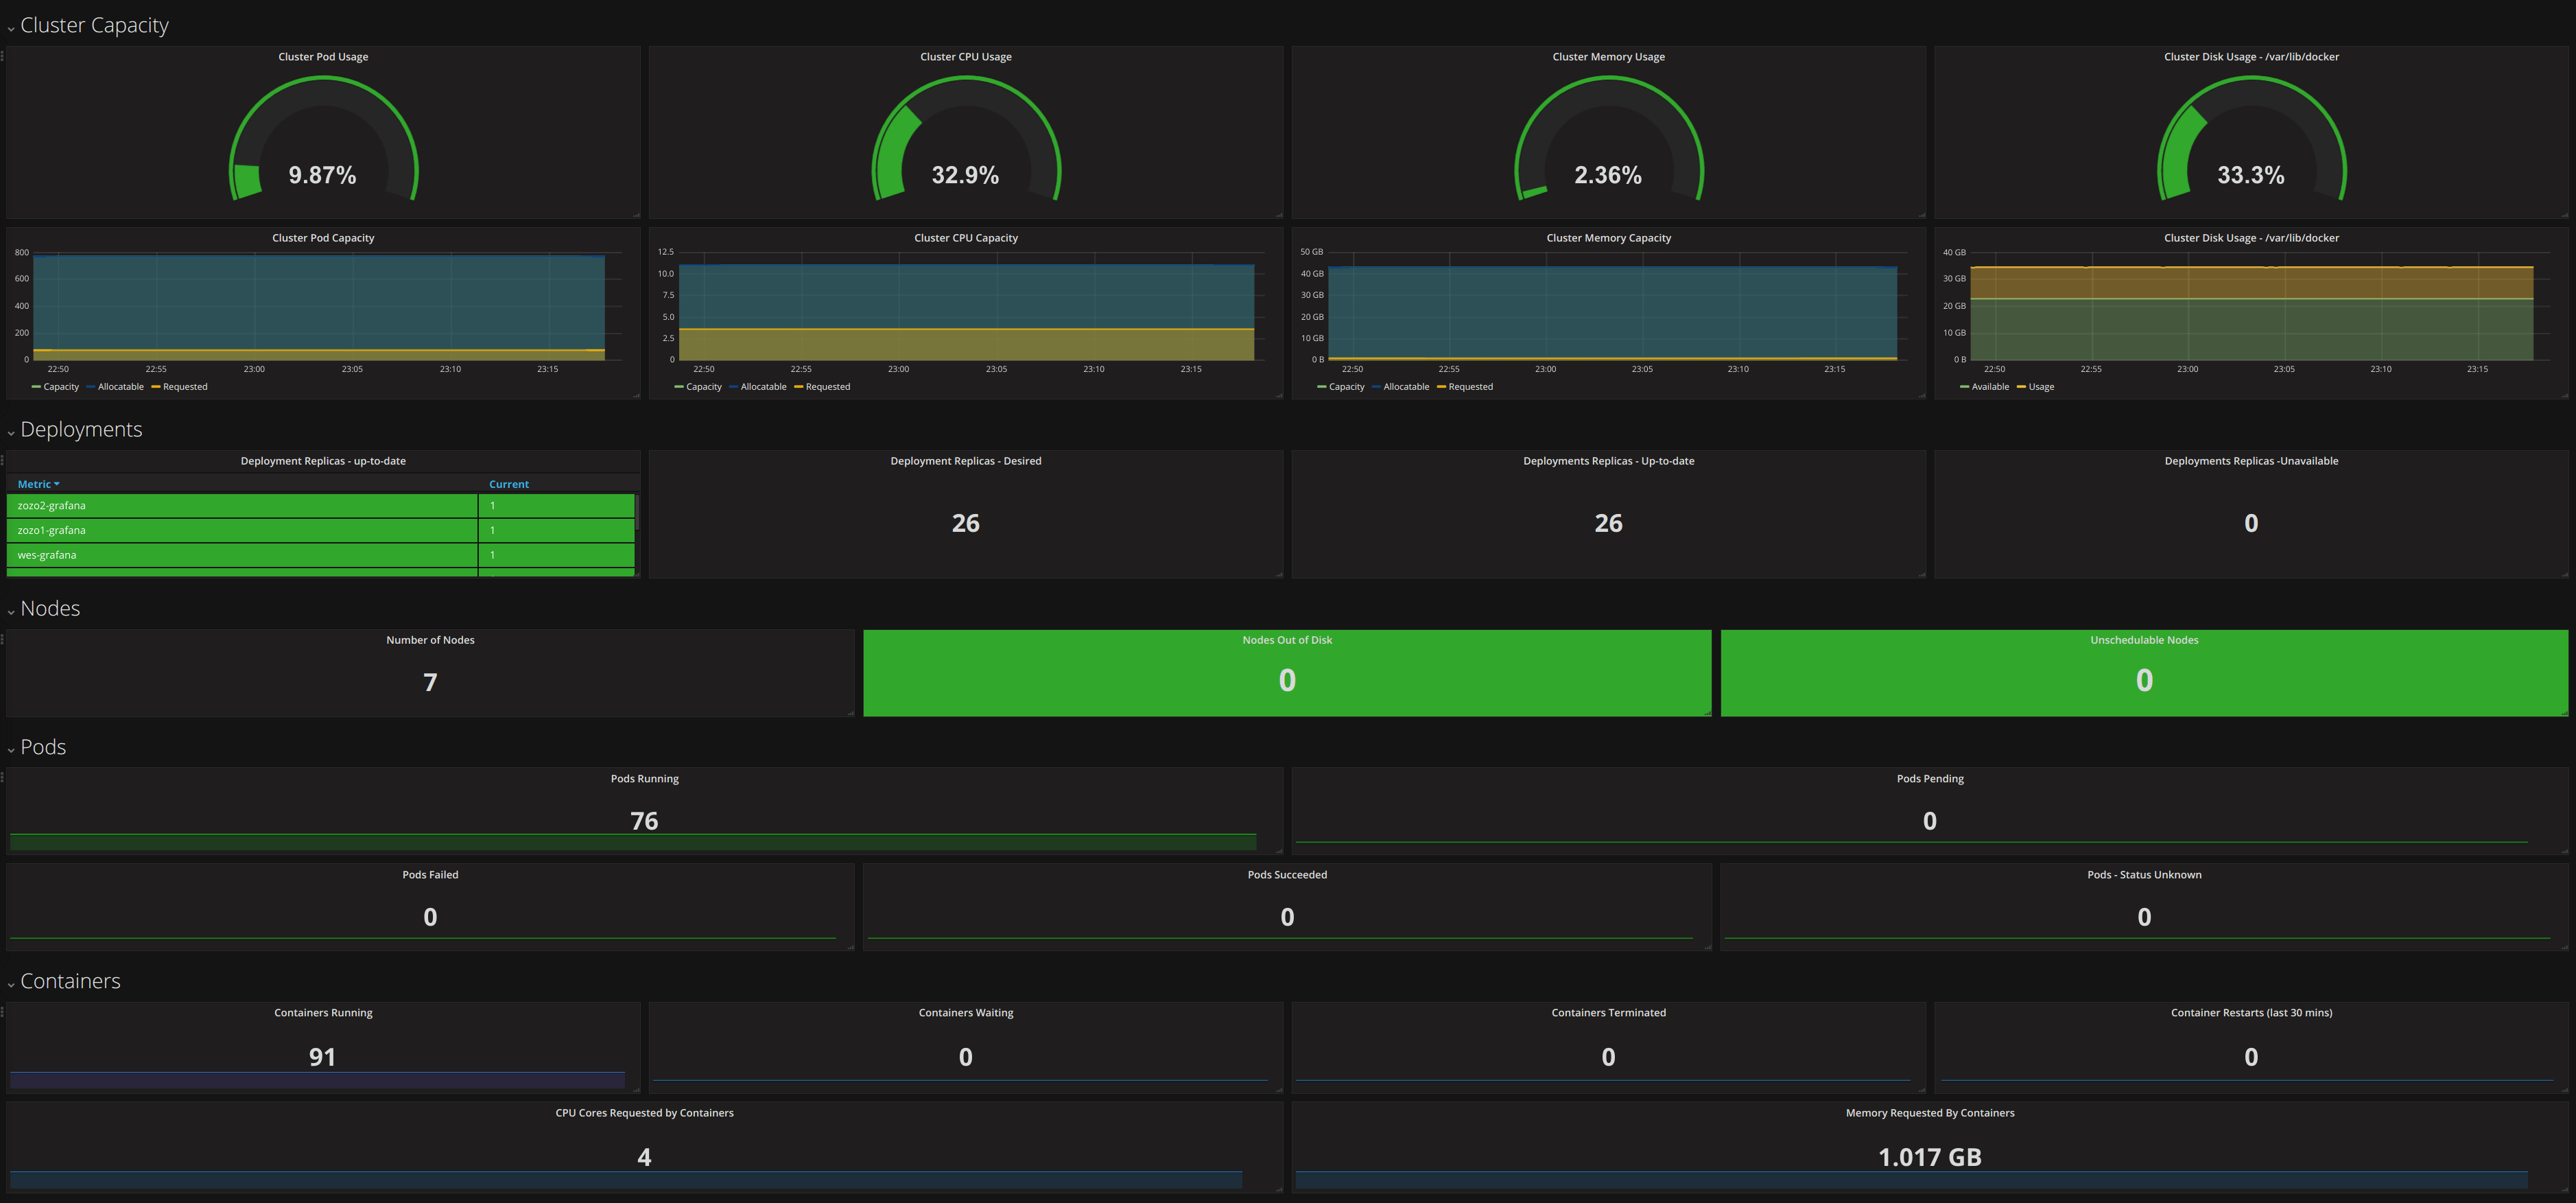
Cluster Metrics
- Pod Capacity/Usage
- Memory Capacity/Usage
- CPU Capacity/Usage
- Disk Capacity/Usage
- Overview of Nodes, Pods and Containers
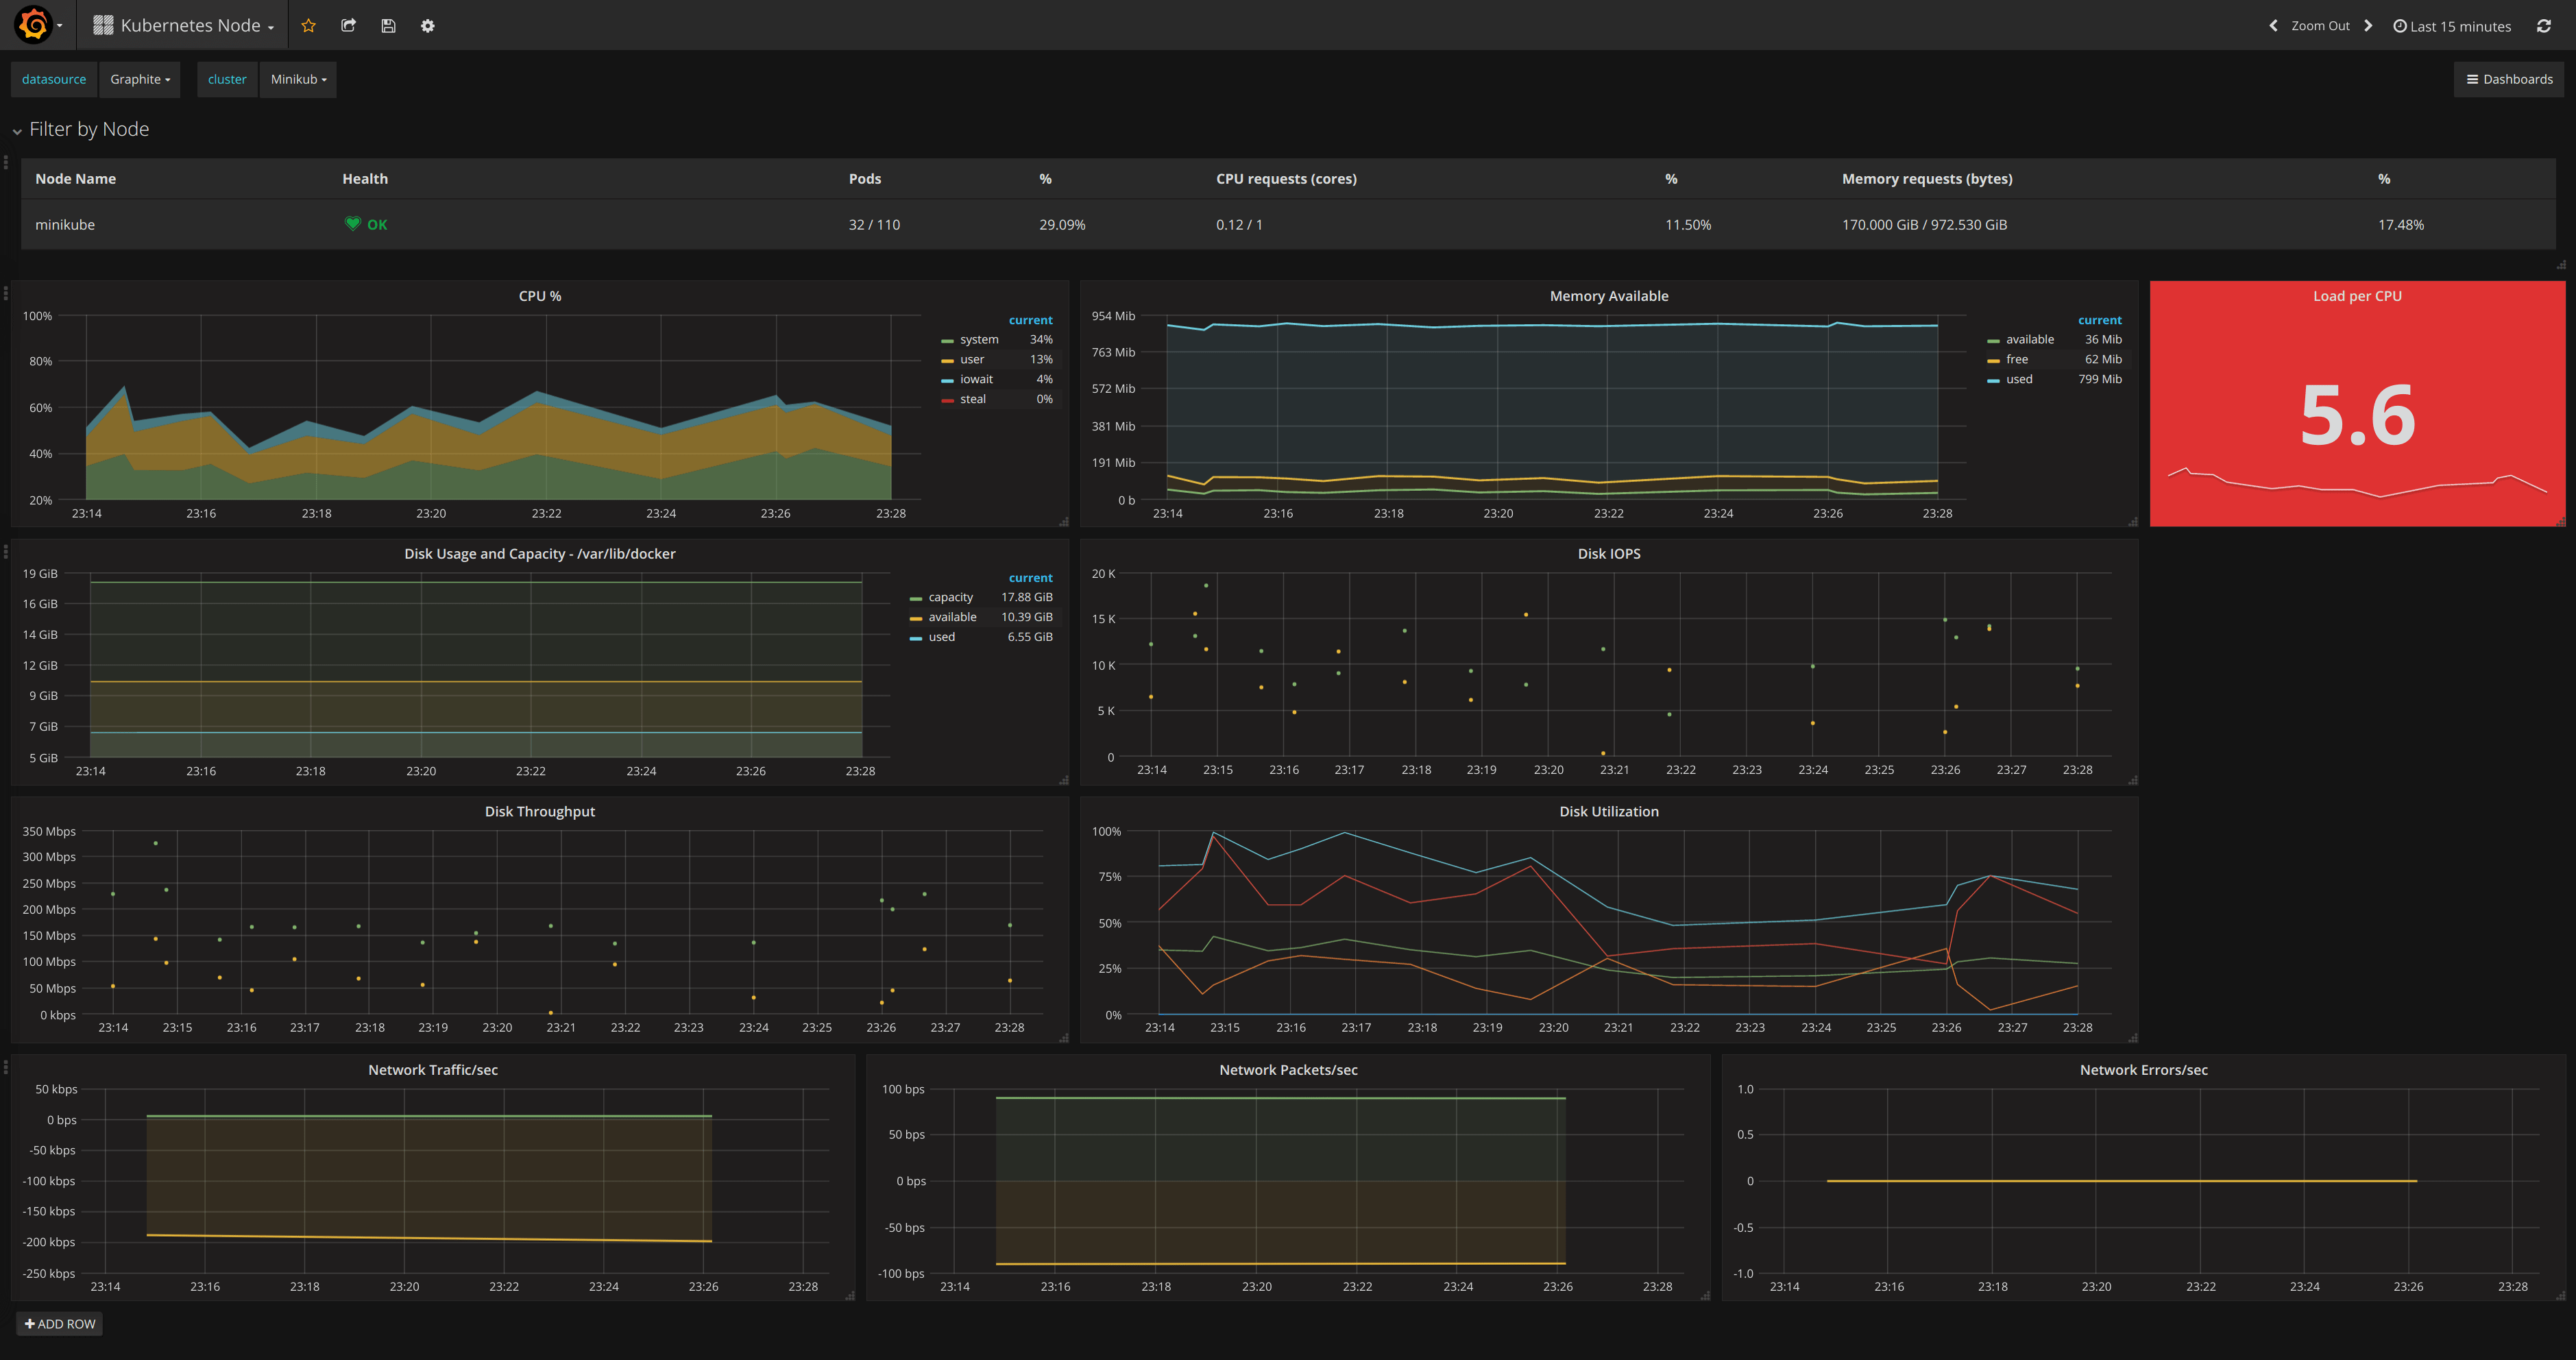
Node Metrics
- CPU
- Memory Available
- Load per CPU
- Read IOPS
- Write IOPS
- %Util
- Network Traffic/second
- Network Packets/second
- Network Errors/second
Pod/Container Metrics
- Memory Usage
- Network Traffic
- CPU Usage
- Read IOPS
- Write IOPS
Documentation
Installation
- Use the grafana-cli tool to install kubernetes from the commandline:
grafana-cli plugins install kubernetes-app
Restart your Grafana server.
Log into your Grafana instance. Navigate to the Plugins section, found in the Grafana main menu. Click the Apps tabs in the Plugins section and select the newly installed Kubernetes app. To enable the app, click the Config tab and click on the Enable button.
Connecting to your Cluster
Go to the Cluster List page via the Kubernetes app menu.
Click the
New Clusterbutton.Fill in the Auth details for your cluster.
Choose the Prometheus datasource that will be used for reading data in the dashboards.
Click
Deploy. This will deploy a Node Exporter DaemonSet, to collect health metrics for every node, and a Deployment that collects cluster metrics.
Feedback and Questions
Please submit any issues with the app on Github.
Grafana Cloud Free
- Free tier: Limited to 3 users
- Paid plans: $55 / user / month above included usage
- Access to all Enterprise Plugins
- Fully managed service (not available to self-manage)
Self-hosted Grafana Enterprise
- Access to all Enterprise plugins
- All Grafana Enterprise features
- Self-manage on your own infrastructure
Install on Grafana Cloud
Plugins can be installed directly from within your Grafana instance or automated using the Cloud API or Terraform.
Learn more about plugin installationMarketplace plugins
This is a paid plugin developed by a marketplace partner. To purchase an entitlement, sign in first, then fill out the contact form.
Get this plugin
This is a paid for plugin developed by a marketplace partner. To purchase entitlement please fill out the contact us form.
What to expect:
- Grafana Labs will reach out to discuss your needs
- Payment will be taken by Grafana Labs
- Once purchased the plugin will be available for you to install (cloud) or a signed version will be provided (on-premise)
Thank you! We will be in touch.
For more information, visit the docs on plugin installation.
Installing on a local Grafana:
For local instances, plugins are installed and updated via a simple CLI command. Plugins are not updated automatically, however you will be notified when updates are available right within your Grafana.
1. Install the Application
Use the grafana-cli tool to install kubernetes from the commandline:
grafana-cli plugins install The plugin will be installed into your grafana plugins directory; the default is /var/lib/grafana/plugins. More information on the cli tool.
Alternatively, you can manually download the .zip file for your architecture below and unpack it into your grafana plugins directory.
Alternatively, you can manually download the .zip file and unpack it into your grafana plugins directory.
2. Enable it
Next, log into your Grafana instance. Navigate to the Plugins section, found in your Grafana main menu.
Click the Apps tabs in the Plugins section and select the newly installed app.
To enable the app, click the Config tab. Follow the instructions provided with the application and click Enable. The app and any new UI pages are now accessible from within the main menu, as designed by the app creator.
If dashboards have been included with the application, they will attempt to be automatically installed. To view the dashboards, re-import or delete individual dashboards, click the Dashboards tab within the app page.