New in the Kubernetes integration for Grafana Cloud: Kubernetes events, Pod logs, and more
The Kubernetes integration for Grafana Cloud helps users easily monitor and alert on core Kubernetes metrics using the Grafana Agent, our lightweight observability data collector optimized for sending metric, log, and trace data to Grafana Cloud. It packages together a set of easy-to-deploy manifests for the Agent, along with prebuilt dashboards and alerts.
Since we last updated the Kubernetes integration for Grafana Cloud with new dashboards, a Kubernetes homepage, alerts, and more, we’ve added several new features.
This update includes the following enhancements:
- Support for Kubernetes events
- Support for collecting and shipping container logs to Grafana Cloud
- Reduced metric cardinality
- Support for rolling out Agent as a StatefulSet, preserving its write-ahead log (WAL) and event history
- Kubernetes-mixin updates
To learn how to update to the latest version, please see our documentation on Updating the Kubernetes integration.
Support for Kubernetes events (beta)
Kubernetes events give you deep insight into your cluster’s behavior. They are emitted by most controllers and get persisted in the control plane’s etcd store — but only for an hour. With the Grafana Agent’s embedded eventhandler integration, you can watch Kubernetes events as they occur, and ship them to a Loki sink, such as Grafana Cloud, for long-term storage, querying, and analysis.
You may be familiar with Kubernetes events as the output of running kubectl get event or kubectl describe pod … You can now browse and parse through this rich source of logging data directly from Grafana, create metrics from events using LogQL’s powerful metric queries feature, and then create alerts to get notified when Pods are getting OOM-killed or can’t get scheduled.

To get you up and running, we’ve added an Events panel to the K8s integration homepage dashboard:

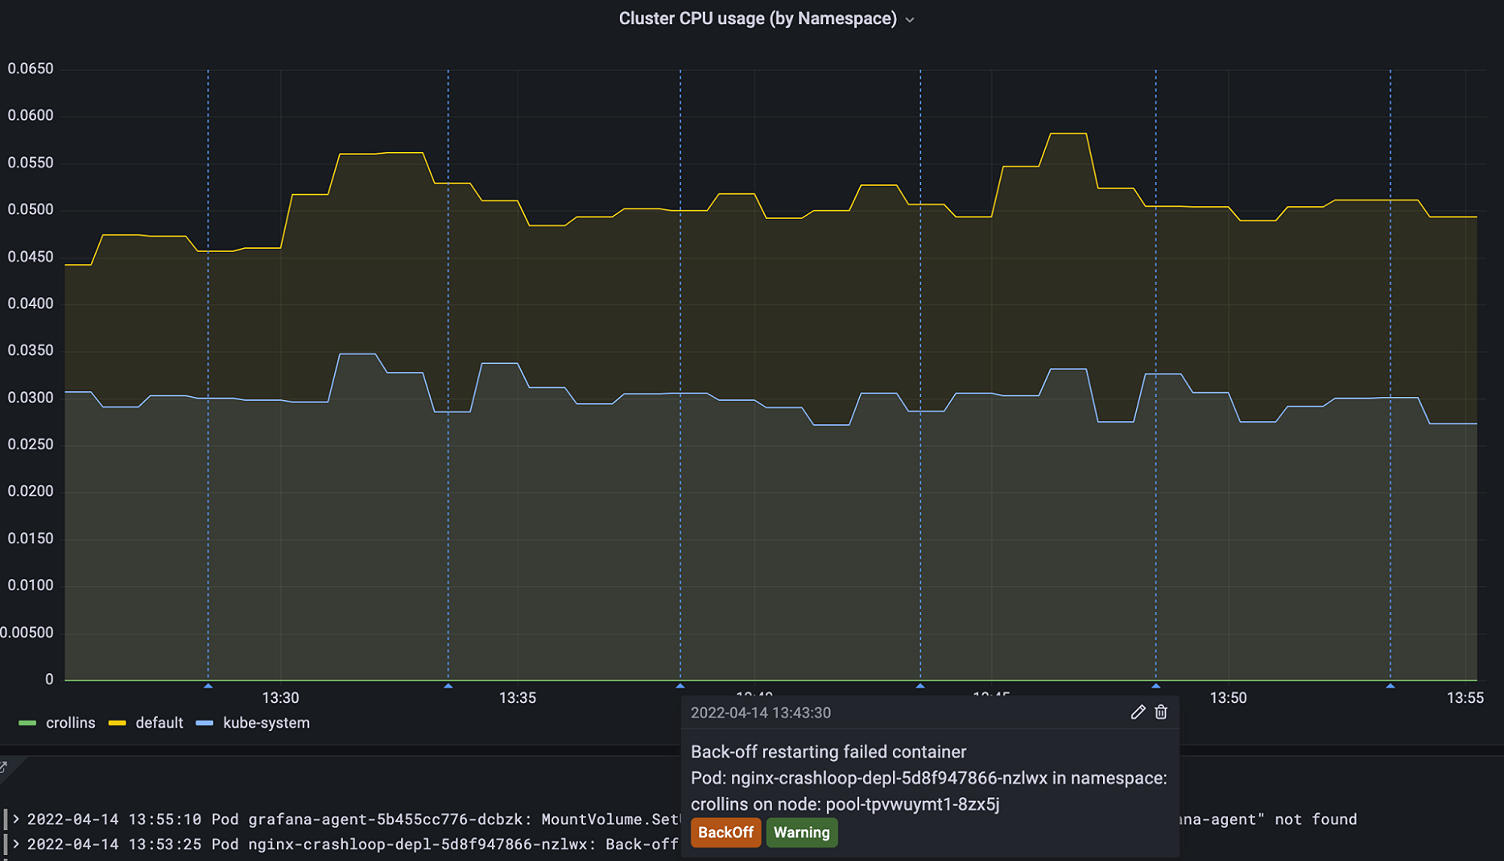
We’ve also added annotations to panels throughout the K8s integration dashboards so you can correlate changes in resource usage with events in your cluster:

These can be modified using Grafana’s annotations configuration or turned off entirely using the toggle at the top of the dashboards.
You can get started browsing Kubernetes events using Grafana’s Explore view. By default events are labeled with the job="integrations/kubernetes/eventhandler" label. You can modify this in your Agent configuration:

Finally, in the setup wizard of the Kubernetes integration, we’ve enabled this integration by default. You can disable it by deleting the integrations stanza in the provided Agent ConfigMap.
Collect and ship container logs
You can now collect and ship all your container logs to Grafana Cloud Logs seamlessly using Grafana Agent’s embedded log collector.
To get started shipping logs, head to the setup view in the Kubernetes integration, and follow the quickstart instructions to deploy the preconfigured Agent manifests into your cluster. This will roll out a DaemonSet of Grafana Agents that tail container logs, apply a convenient set of labels for querying, and remote_write log entries to Cloud Logs for storage, analysis, and querying.

You may need to modify your Agent’s configuration to suit your querying/analysis use case, but by default you can use {pod="pod_name"} to see logs for a given Pod. In a similar fashion, the cluster, container, and namespace labels are set for convenient querying out of the box.
Using LogQL’s powerful metric queries feature, you can then create metrics from logs as well as alerts to get notified when your workloads aren’t behaving as expected.
Finally, you can correlate metrics to logs in Explore by using Grafana’s “split” feature. To use this, navigate to Explore, and query a Prometheus metric. Then hit Split, and choose the Loki data source in the split pane. The labels from your metric query will get propagated over to the Loki pane’s query so you can quickly look at a metric and its corresponding logs, side-by-side:

To learn more about correlating metrics, logs, and traces with Grafana Cloud, you can watch our Correlation webinar on demand.
More Kubernetes integration updates
Reduced metric cardinality
We’ve removed internal kubelet metrics, which contributed significant amounts of cardinality (read: cost) to the K8s integration’s default set of scraped metrics, and they are seldom used in day-to-day operations.
As always, the Kubernetes integration’s default configuration contains a handy allowlist of metrics to make the integration more affordable. With these changes, it’ll be even more cost-effective to monitor your Kubernetes clusters with Grafana Cloud.
Agent StatefulSet
We’ve updated our default Agent manifests to use a StatefulSet to run the Agent, instead of a Deployment.
This allows the Agent to persist its write-ahead-log across restarts and crashes and pick up where it left off should something go wrong.
Kubernetes mixin updates
Grafana Cloud’s Kubernetes integration is heavily dependent on the upstream Kubernetes OSS mixin project. We’ve brought in the latest changes and bug fixes (some of which we’ve contributed) so you can take advantage of bleeding edge updates to the upstream project.
As always, we are indebted to the vibrant community of open source developers that maintain the Kubernetes mixin, and we will continue to support and contribute to the project, as well as add new open source features to improve Kubernetes observability for all.
What’s next for the Kubernetes integration
Our engineering team is hard at work getting existing Grafana Cloud integrations, like node-exporter, the MySQL integration, and others working on Kubernetes as a platform.
Agent Operator recently added support for managing integrations using Custom Resource Definitions (CRDs), and we’ll soon bring these changes into our more user-friendly onboarding experience.
We’re also hard at work building our next generation Kubernetes monitoring solution that builds on top of the benefits of our current integration. With the next release, there will be new views that help you seamlessly navigate through your cluster’s workloads (inspired by tools like K9s) and quickly jump to the relevant alerts, metrics, and logs. Here’s a not-so-sneak preview:


Get started with the Kubernetes integration for Grafana Cloud
The new version of the Kubernetes integration is generally available in Grafana Cloud. Install it today using the Walkthrough from your hosted Grafana instance.
If you’re already running the integration and would like to upgrade, please see our Updating the Kubernetes integration documentation.
To learn more about all the included features and to find additional configuration instructions, please see the Kubernetes integration docs.
If you’re not already using Grafana Cloud — the easiest way to get started with observability — sign up now for a free 14-day trial of Grafana Cloud Pro, with unlimited metrics, logs, traces, and users, long-term retention, and access to one Enterprise plugin.