
New in the Kubernetes integration for Grafana Cloud: curated dashboards, built-in alerts, and more
Back in May, we announced the Kubernetes integration to help users easily monitor and alert on core Kubernetes cluster metrics using the Grafana Agent, our lightweight observability data collector optimized for sending metric, log, and trace data to Grafana Cloud.
The integration allows Grafana Cloud users to monitor and alert on Kubernetes cluster metrics. Since the original release, we’ve added new features and enhancements to help our users go even further.
Install the Kubernetes integration
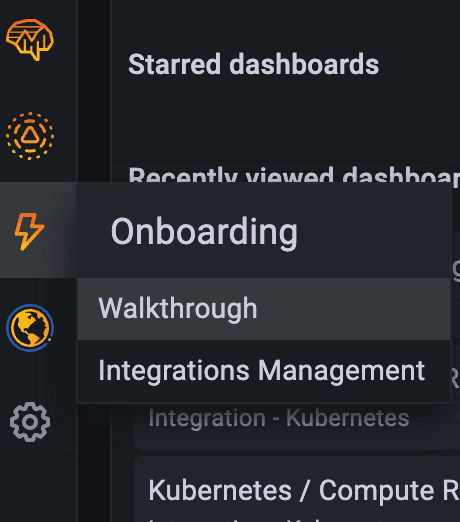
To install the Kubernetes integration, use the Walkthrough from your hosted Grafana instance:
To learn more, please see the Kubernetes integration docs.
To upgrade from the previous version, uninstall the current version of the Kubernetes integration using Integrations Management, and reinstall it using the walkthrough plugin. To learn more, please see the Kubernetes documentation.
New in the Kubernetes integration
1. Dashboards
This update includes dashboards that highlight and explore two main use cases. These use cases capture common questions and insights sought by many Kubernetes operators:
Monitoring workload resource usage
This set of dashboards explores the health, performance, and resource usage of workloads running in your Kubernetes cluster.
It includes 7 dashboards to drill down into resource usage at the following levels:
- Multi-cluster
- Cluster
- Namespace (by Pods)
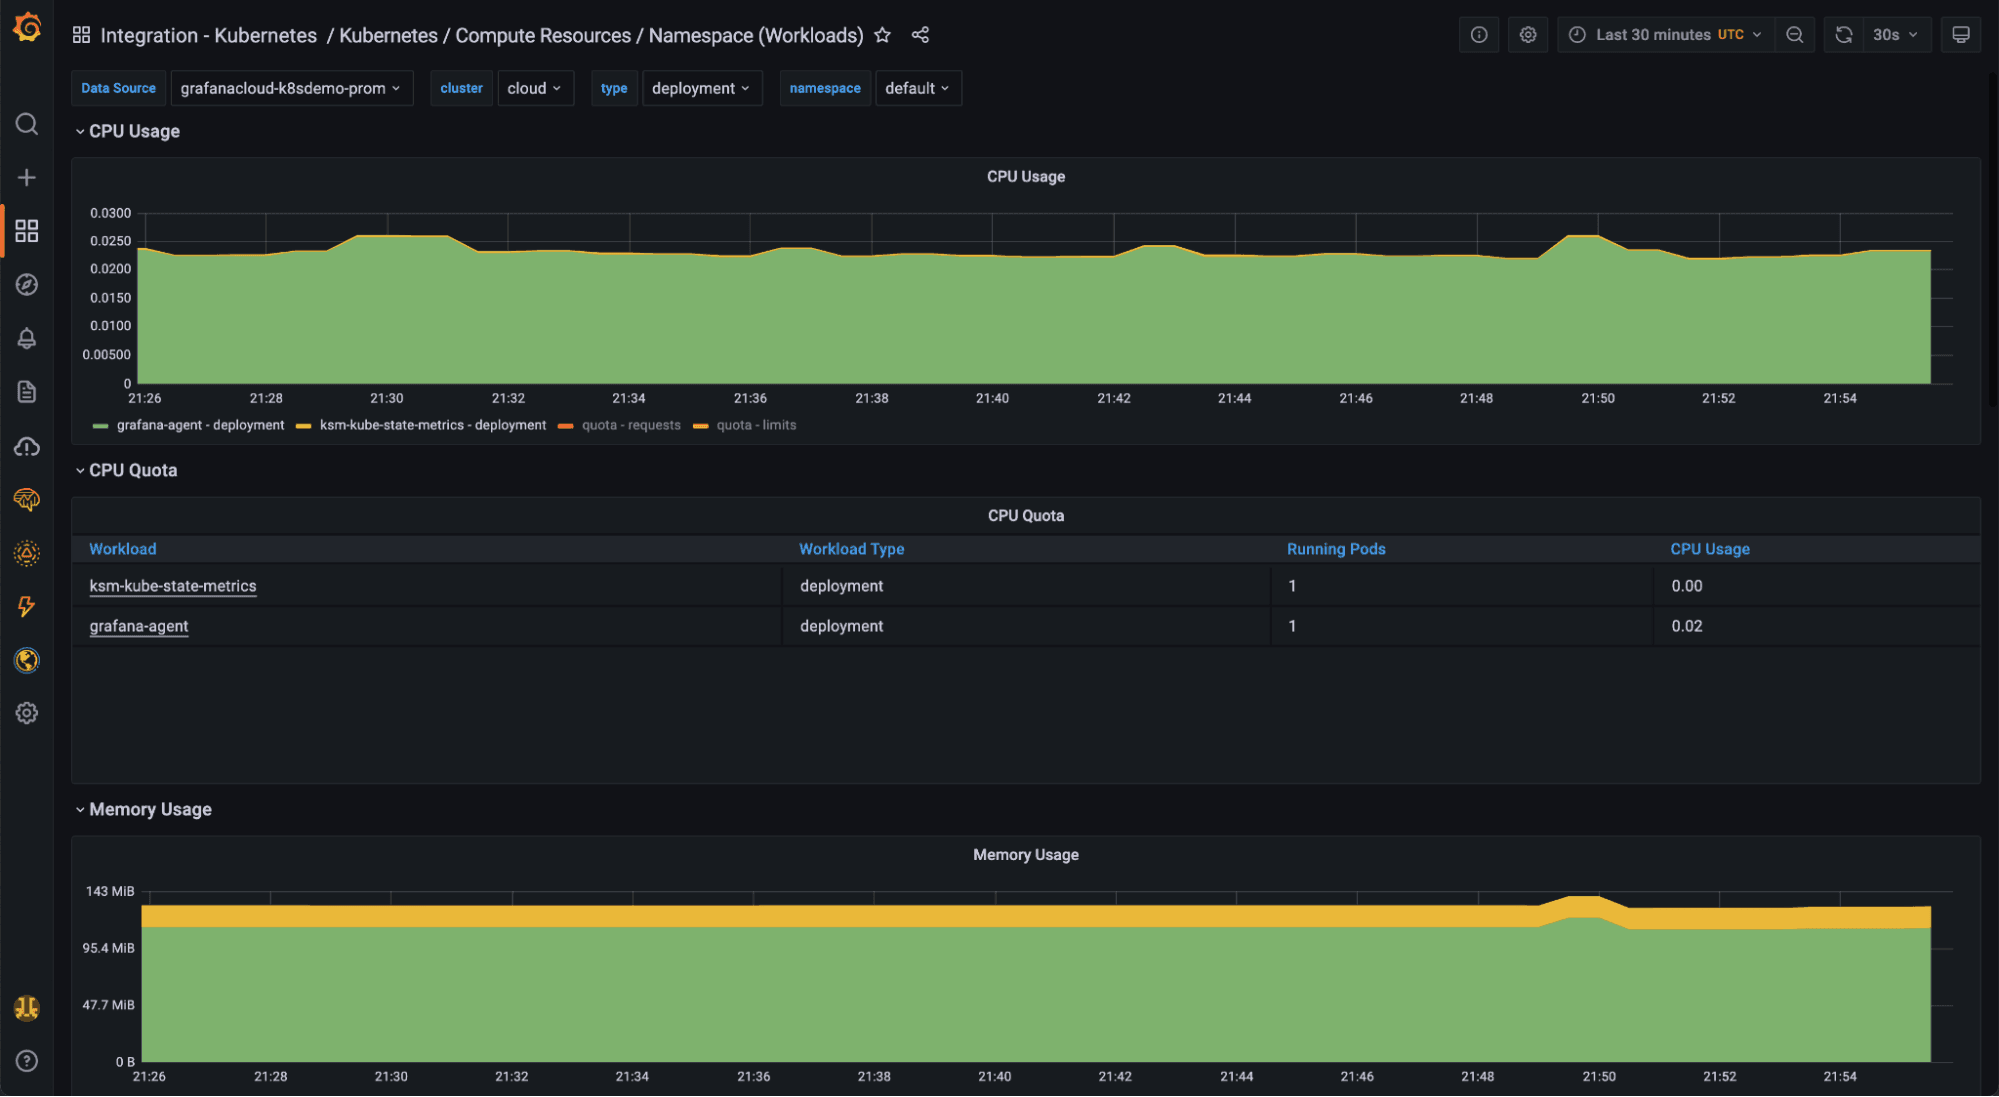
- Namespace (by workloads, like Deployments or DaemonSets)
- Node
- Pods and containers
- Workloads (Deployments, DaemonSets, StatefulSets, etc.)
These dashboards contain links to sub-objects, so you can jump from cluster, to Namespace, to Pod, to Container. Along with accompanying alerts, these dashboards help ensure your Kubernetes workloads are healthy, performing as expected, and respecting their resource limits and requests.
Monitoring cluster operations
This set of dashboards explores the health and performance of cluster components. It includes:
- Kubernetes / Kubelet, a dashboard that helps you understand Kubelet performance on your Nodes, and provides useful summary metrics like number of running Pods, Containers, and Volumes on a given Node
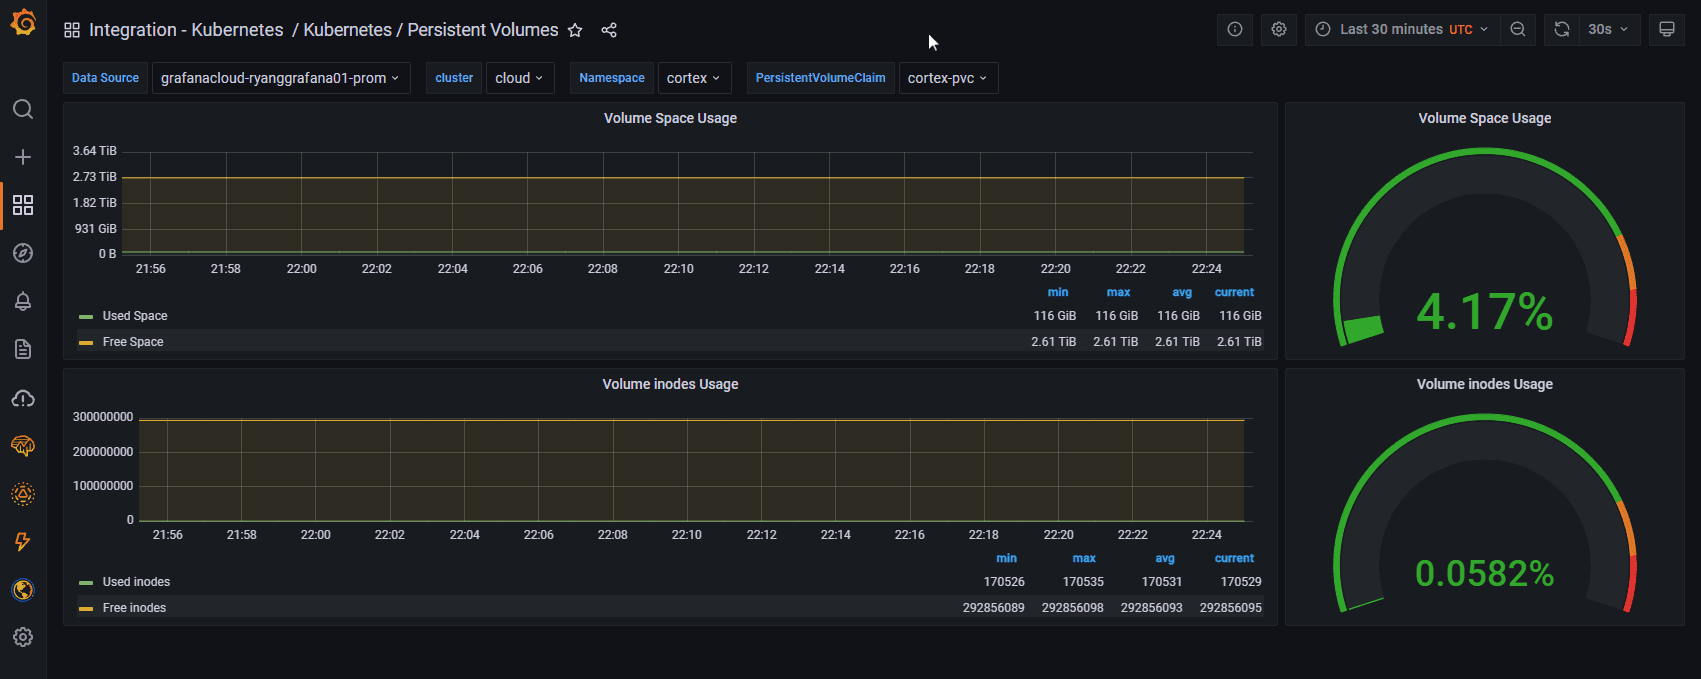
- Kubernetes / Persistent Volumes, a dashboard that helps you understand usage of your configured PersistentVolumes
2. Kubernetes homepage
The Kubernetes integration now includes a main home page which allows you to conveniently explore this set of curated dashboards.
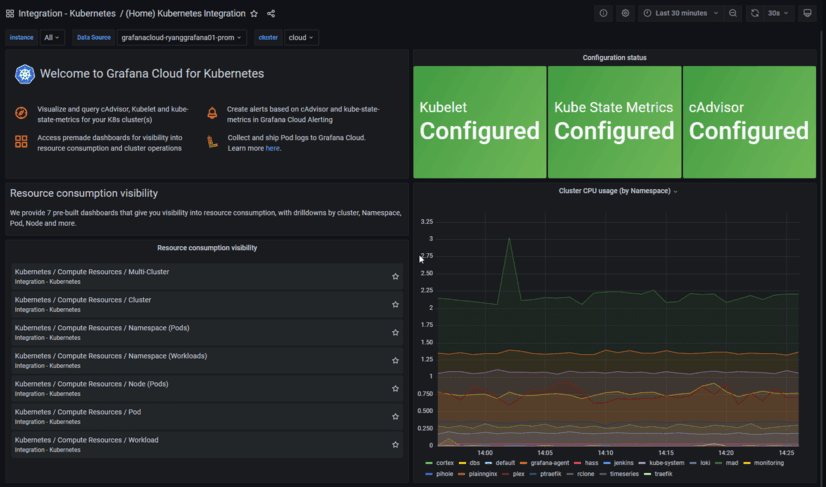
Two panels highlight the dashboards for each use case mentioned above:
- Resource consumption visibility: Explore resource utilization, contention, and commitment (requests and limits) for your workloads. You can explore this data in a variety of ways, from Namespaces, to Nodes, to workload objects like Deployments, StatefulSets, DaemonSets, and more.
- Cluster operations visibility: Gain insights into the operations of cluster components, with a focus on Kubelet operations and resource consumption, and PersistentVolume performance.
3. Container logs

In the top-left panel of the homepage dashboard, you’ll find a link to the Grafana Agent Logs Quickstart which will show you how to roll out a Grafana Agent DaemonSet to collect Container and Pod logs. You can then correlate these with your Pod and application metrics.
In the near future, the Kubernetes integration will set up container logging and correlation out of the box.
To learn how to collect Pod logs using Grafana Agent, please see the Grafana Agent Logs Quickstart.
4. Alerts
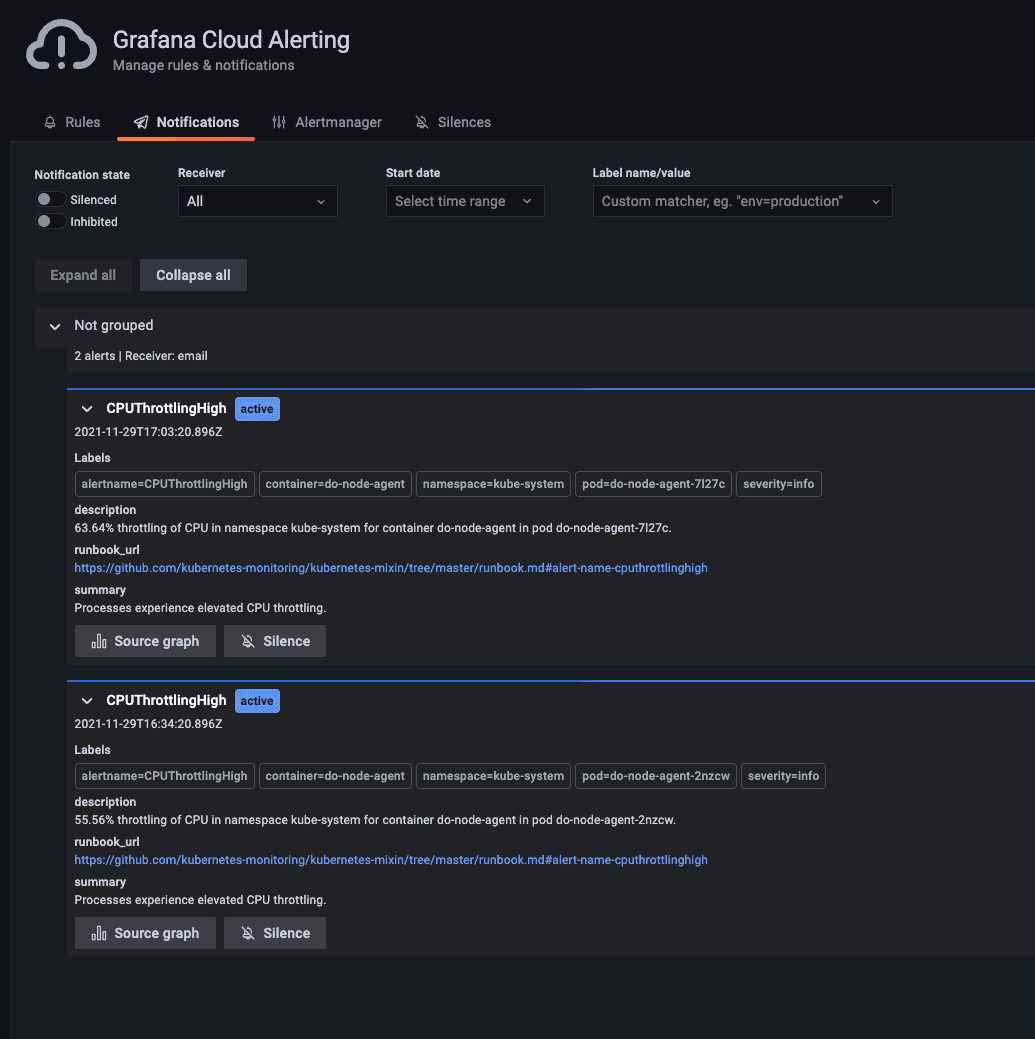
The Kubernetes integration now builds in several alerts for key cluster metrics:
- Application alerts inform you of issues like Pods crash looping, Deployments and DaemonSets not being scheduled or rolled out, and much more.
- Resource alerts inform you about CPU and memory overcommitments as well as quota utilization.
- System and kubelet alerts warn you about operational issues with your Kubernetes clusters.
To learn more, please see the Kubernetes integration documentation.
5. Kube-state-metrics
One key to understanding the overall health of your cluster and optimizing your resource allocation is knowing how much of your available capacity has been committed through requests and limits.
The integration now includes instructions for instrumenting your cluster with kube-state-metrics, which provides data around Pod requests and limits as well as Kubernetes object metrics. The resource dashboards surface these metrics in convenient ways and help you visualize resource allocation in your cluster.
6. Preconfigured metric allowlist
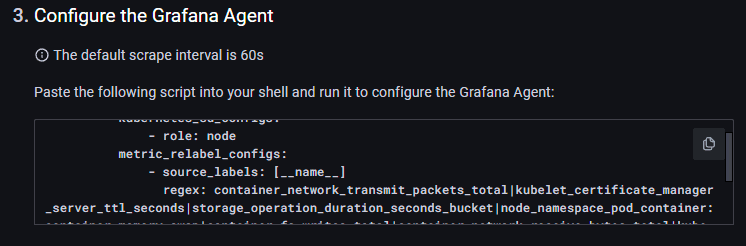
One challenge with Kubernetes observability is the proliferation of metrics and extremely high metric cardinality.
The Grafana Agent configuration generated by the Kubernetes integration now has metric_relabel_configs which allowlists metrics used by the integration dashboards, alerts, and recording rules. All other metrics are dropped by default. The allowlist is optional and easily omitted by removing the metric_relabel_confgs stanzas from your Agent config.
Depending on the size and load on your cluster, the Kubernetes integration may ship a large number of active series. With preconfigured allowlists, you’ll only be shipping metrics that you need to power the integration and its alerts.
To learn more, please see the Kubernetes integration documentation.
Community alignment
This integration wouldn’t be possible without countless contributions from the thriving community around the open source Kubernetes mixin.
The first release of this integration was heavily inspired by this upstream project. With this release, we’re further aligning ourselves with the community by directly incorporating a subset of the upstream mixin. In this process, we found a handful of small issues which we fixed and merged into the upstream repo.
We’re committed to helping improve and maintain the mixin, and we acknowledge with gratitude the work from over 140 contributors and counting!
What’s next for the Kubernetes integration
In the near future you can expect the Kubernetes integration to work with other Grafana Cloud integrations, like the MySQL integration, Linux Node integration (node-exporter), and our ever-expanding catalog of system-specific integrations. In addition, you can expect more Kubernetes-specific integrations that help you monitor and alert on cluster operations.
Grafana Agent Operator will soon become the default method for managing and deploying Grafana Agent into your Kubernetes clusters. It currently supports metrics and logs, with traces and integrations support under active development.
We’re also building Agent log and trace configuration into the integration to make it even easier to get up and running with all three pillars of observability on Grafana Cloud. You’ll be able to seamlessly correlate across metrics, logs, and traces with a pain-free configuration experience.
This is just the start. If there’s a specific feature you’d like to see, a use case you’d like incorporated, or a nagging bug in a dashboard, please reach out by creating a support ticket from your Grafana Cloud portal or join the #integrations channel in the Grafana Labs Community Slack.
Get started today
The new version of the Kubernetes integration is generally available in Grafana Cloud. Install it today using the Walkthrough from your hosted Grafana instance.
To learn more about included features and to find additional configuration instructions, please see the Kubernetes integration docs and the Kubernetes solutions page.
If you’re not already using Grafana Cloud — our composable observability platform bringing together metrics, logs, and traces with Grafana — we have a free forever plan and custom plans to suit every use case. Sign up for free today!

