Explore Grafana Labs events
Whether you’re just getting started with the LGTM Stack or looking to sharpen your skills on a specific topic like OpenTelemetry or dashboarding, there’s a Grafana Labs event just for you.
Explore all eventsFor the observability obsessed
ObservabilityCON
The flagship observability conference
Join practitioners, experts, and leaders from around the world at our annual flagship observability event for two days of announcements, technical workshops, user success stories, and networking with the Grafana observability community.
- Be the first to see new LGTM Stack observability features and solutions
- Get actionable tips for your observability practices
- Connect with global observability leaders, experts, and builders


ObservabilityCON on the Road
Your local observability conference
Enjoy the excitement of ObservabilityCON closer to home. Right after our flagship observability conference each year, we take the ObservabilityCON keynote and sessions on tour across the globe. These local, one-day events bring the ObservabilityCON experience to a city near you with talks featuring local users and customers.
- See technical sessions from our flagship event
- Hear local customer success stories
- Connect with Grafana Labs experts and community members in your area
- In some cities, watch content in your local language
Observability Sessions
Strategic coaching for observability leaders
Learn the secrets of a successful observability strategy at a half-day event designed for observability managers and leaders. Hear best practices from other leaders who have made observability a priority at their organizations, and explore new technologies and solutions with Grafana Labs experts.
- Assess your organization’s observability maturity
- Set an observability strategy tailored to your needs and goals
- Learn how to advocate up and build momentum for observability

For the dashboard dreamers and community heroes
GrafanaCON
The annual OSS community conference
Bask in the warm orange glow of the Grafana community at our annual event dedicated to all things Grafana, Loki, Mimir, and our other open source projects. It’s packed full of OSS demos, new releases, technical talks, and community awards showcasing the incredible ways folks like you are using Grafana at home and at work.
- Learn about the latest OSS features and releases, best practices, and more from project maintainers and contributors
- Get inspired by community members’ dashboards and use cases in space and beyond
- Meet fellow Grafana users, open source enthusiasts, and builders in the hallway track


GrafanaCON Local
Community conference in your city
Enjoy the enthusiasm and fun of GrafanaCON in a city near you. Right after our flagship community event each year, we bring the keynote and highlights from GrafanaCON to a slate of cities around the globe. These one-day events include talks by local users and opportunities to meet community members in your area.
- Learn about the latest OSS releases and announcements from GrafanaCON
- Hear how local community members are getting creative with Grafana dashboards and other OSS tools
- Network with nearby open source enthusiasts, Grafana users, and OSS project contributors
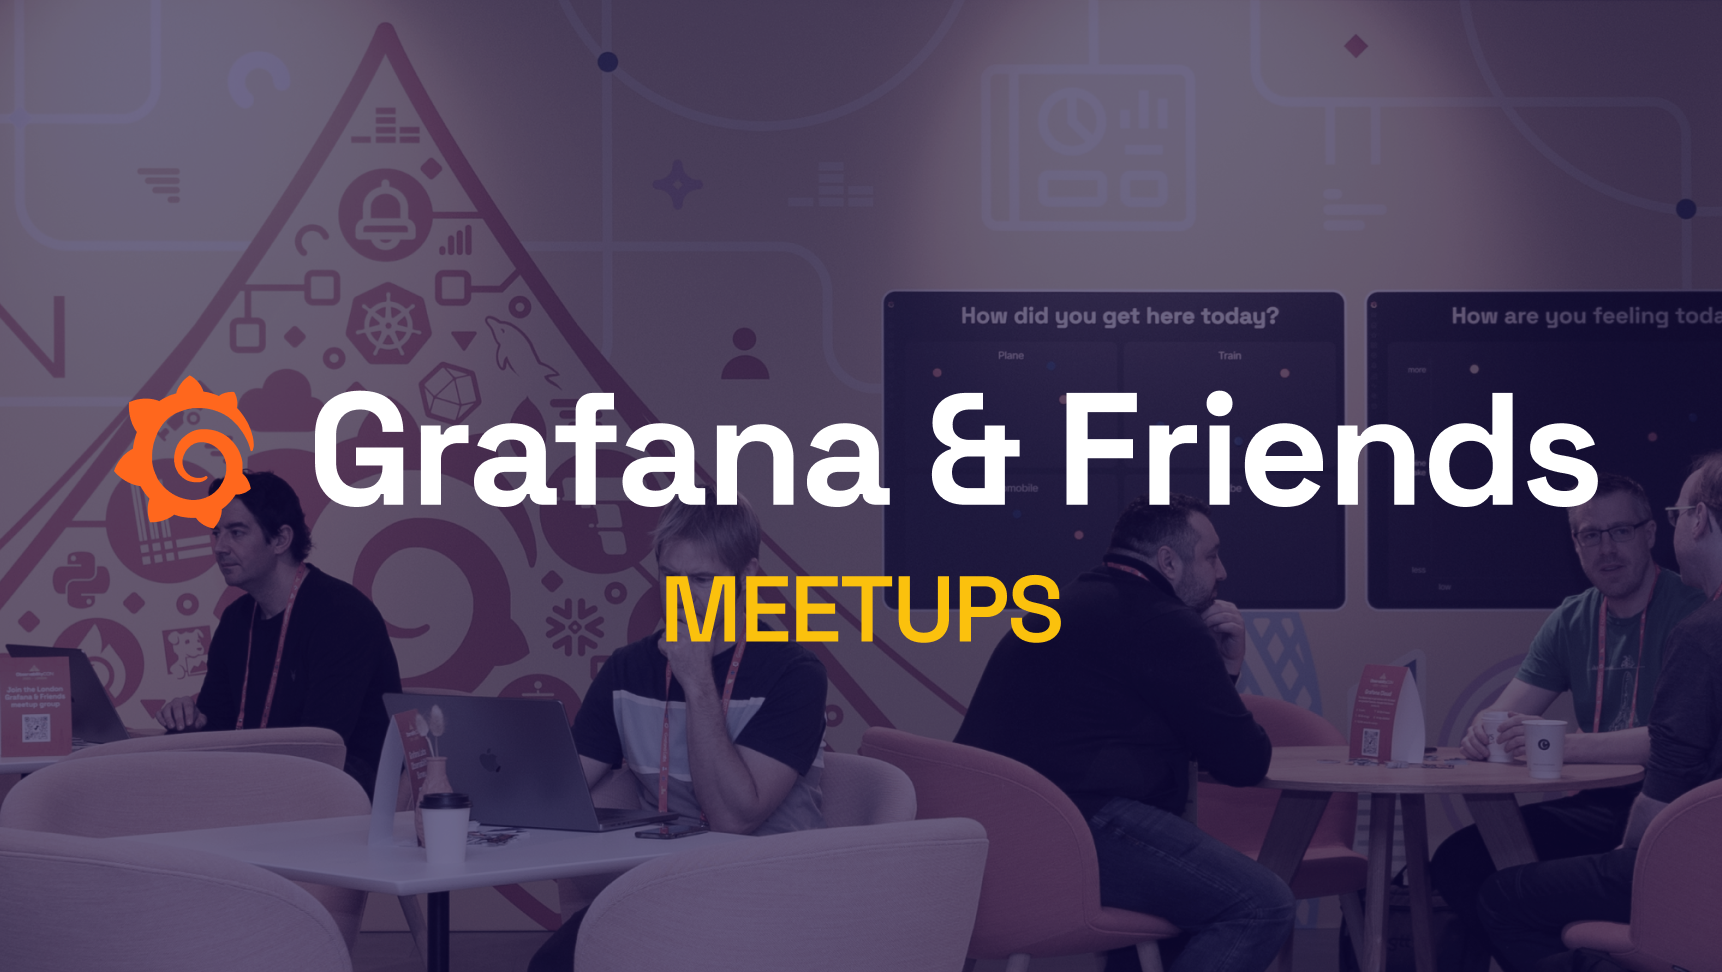
Meetups
Connect with local Grafana users at a meetup in your area. Share what you know, learn something new, and grow your network in a fun and informal setting.
- Enjoy community-driven presentations on a variety of topics
- Participate in hands-on demos and discussions
- Network with Grafana experts and users in your city

Choose your own [educational] adventure
 Webinars
Grafana Labs webinars offer premium content at no additional costs so you can quickly get instruction on specialty topics, like getting started with OpenTelemetry or building advanced Grafana dashboards.
- Watch free – live or on demand
- Re-watch and rewind as often as you like to master key concepts
- Learn in 60 minutes or less of focused instruction by Grafana Labs experts
 Workshops
Grafana Labs workshops are designed to give you everything you need to get started with something new – or take what you already know about the Grafana LGTM stack to the next level.
- Access completely free online or in person
- Get up to 3 hours of technical instruction, including 30 minutes of Q&A
- Enjoy small class sizes, personalized learning environments