A 3-step guide to troubleshooting and visualizing Kubernetes with Grafana Cloud
Back in May, we announced the Kubernetes integration to help users easily monitor and alert on core Kubernetes cluster metrics using the Grafana Agent, our lightweight observability data collector optimized for sending metric, log, and trace data to Grafana Cloud. Since then, we’ve made some improvements to help our customers go even further.
This guide will show how easy it is to use Grafana Cloud to troubleshoot and alert on your Kubernetes cluster, and highlight all of the new features you should check out if you’re already using the k8s integration.
Step 1: Get the Kubernetes integration in Grafana Cloud
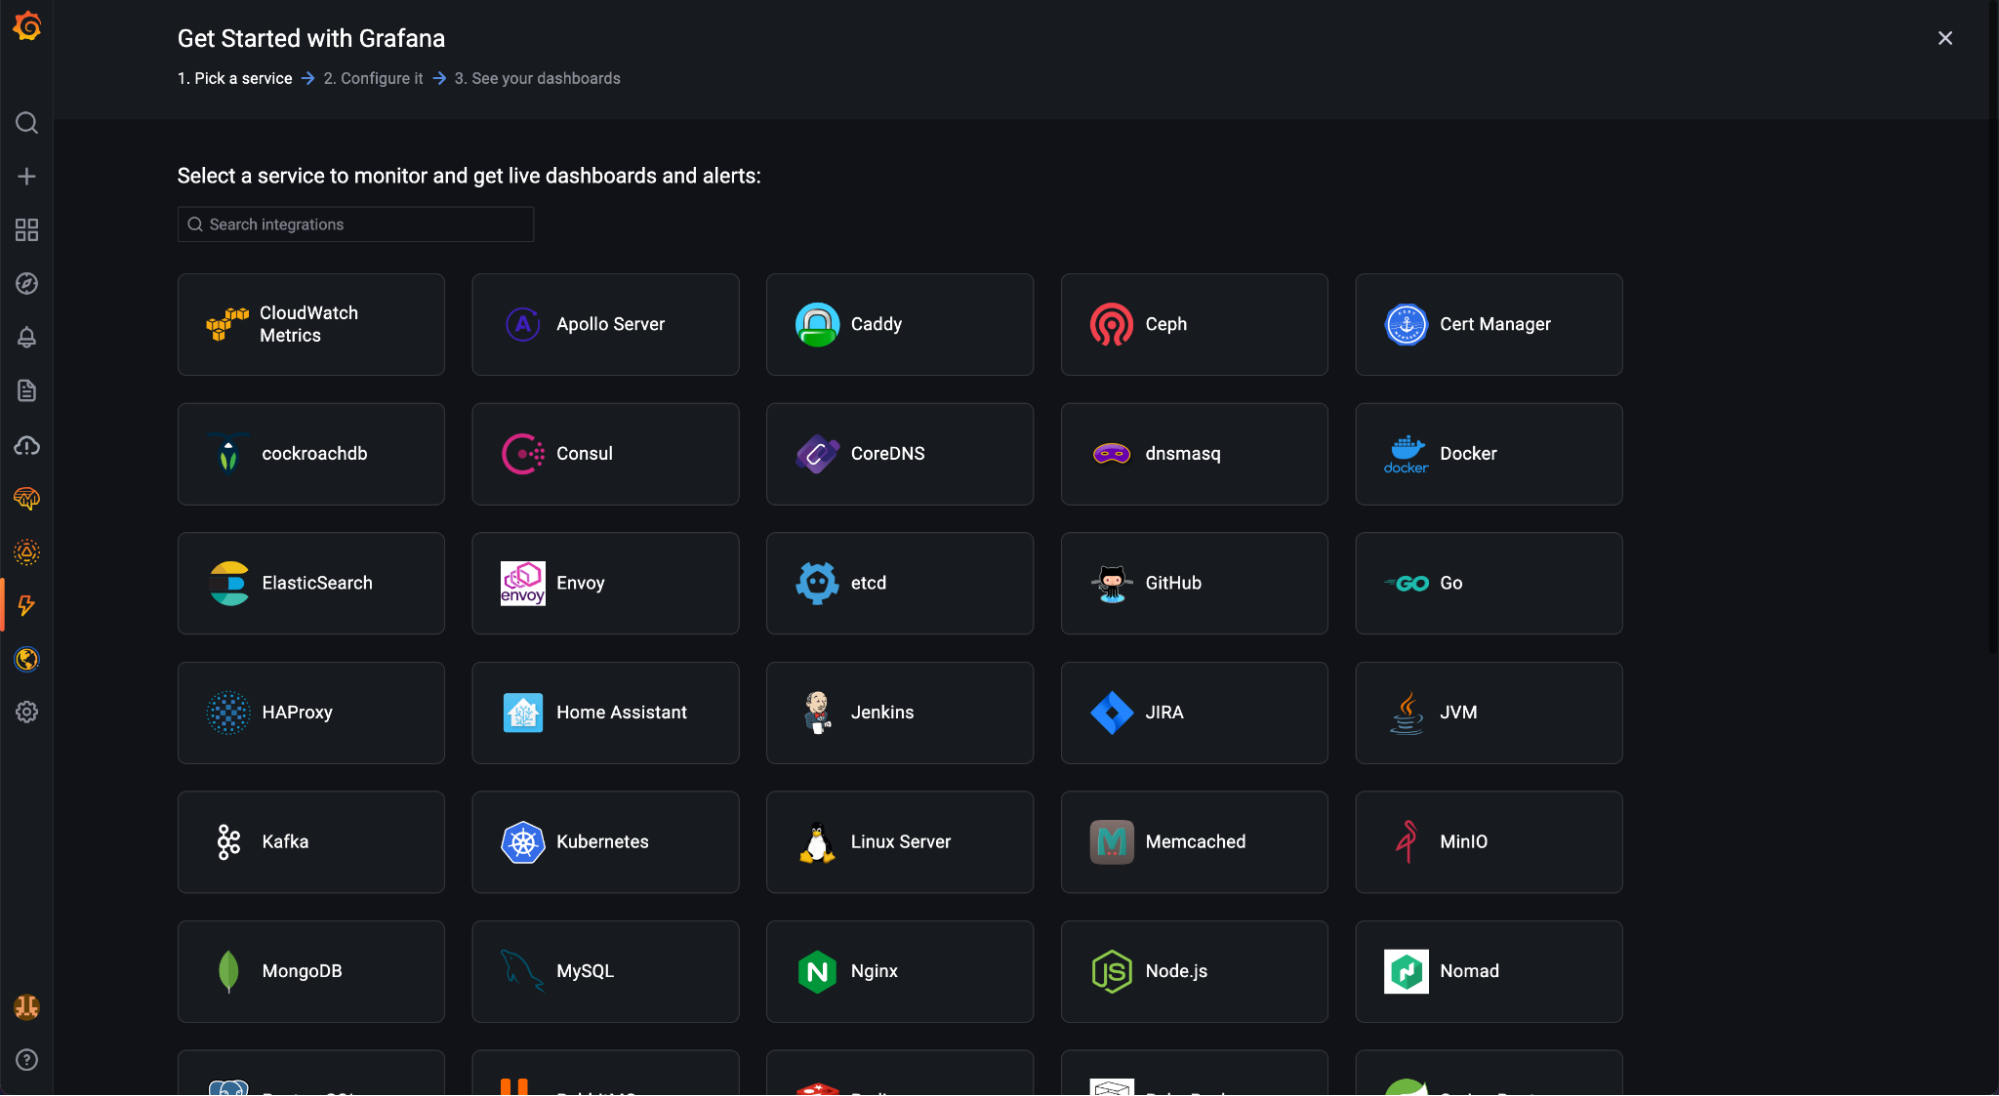
Setting up the integration is fast and easy. From the Grafana Cloud homepage UI, click on the lightning bolt integrations icon on the menu bar and select ‘Walkthrough’ under the Onboarding tab.
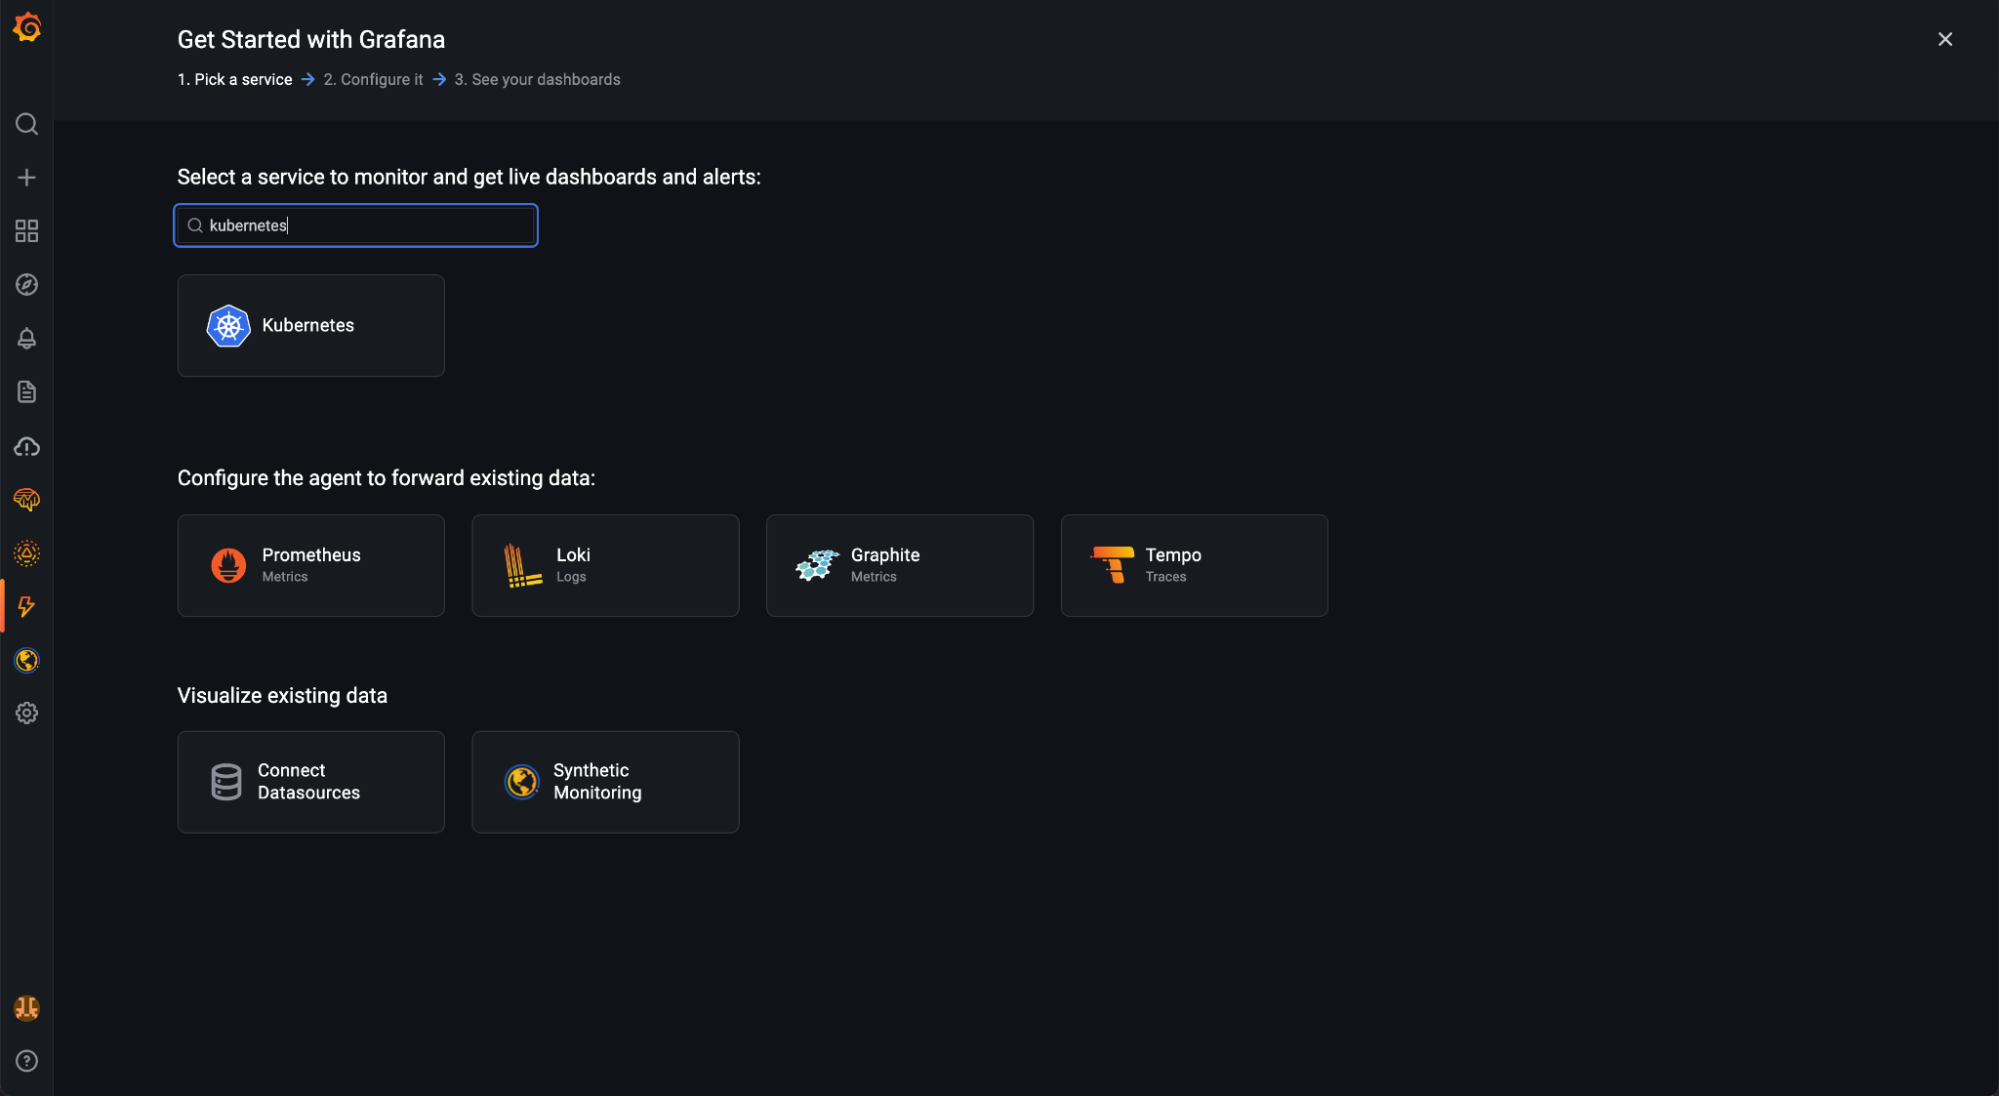
Search for Kubernetes and click install.
Step 2: Configure the Agent to scrape metrics
The Kubernetes integration works by collecting metrics via the Grafana Agent.
The Agent is configured to periodically scrape targets from your Kubernetes cluster like kubelet, cadvisor , etc., eliminating any tedious custom configuration required when using Prometheus Operator.

Use the guided configuration and code snippets provided to finish the install process.
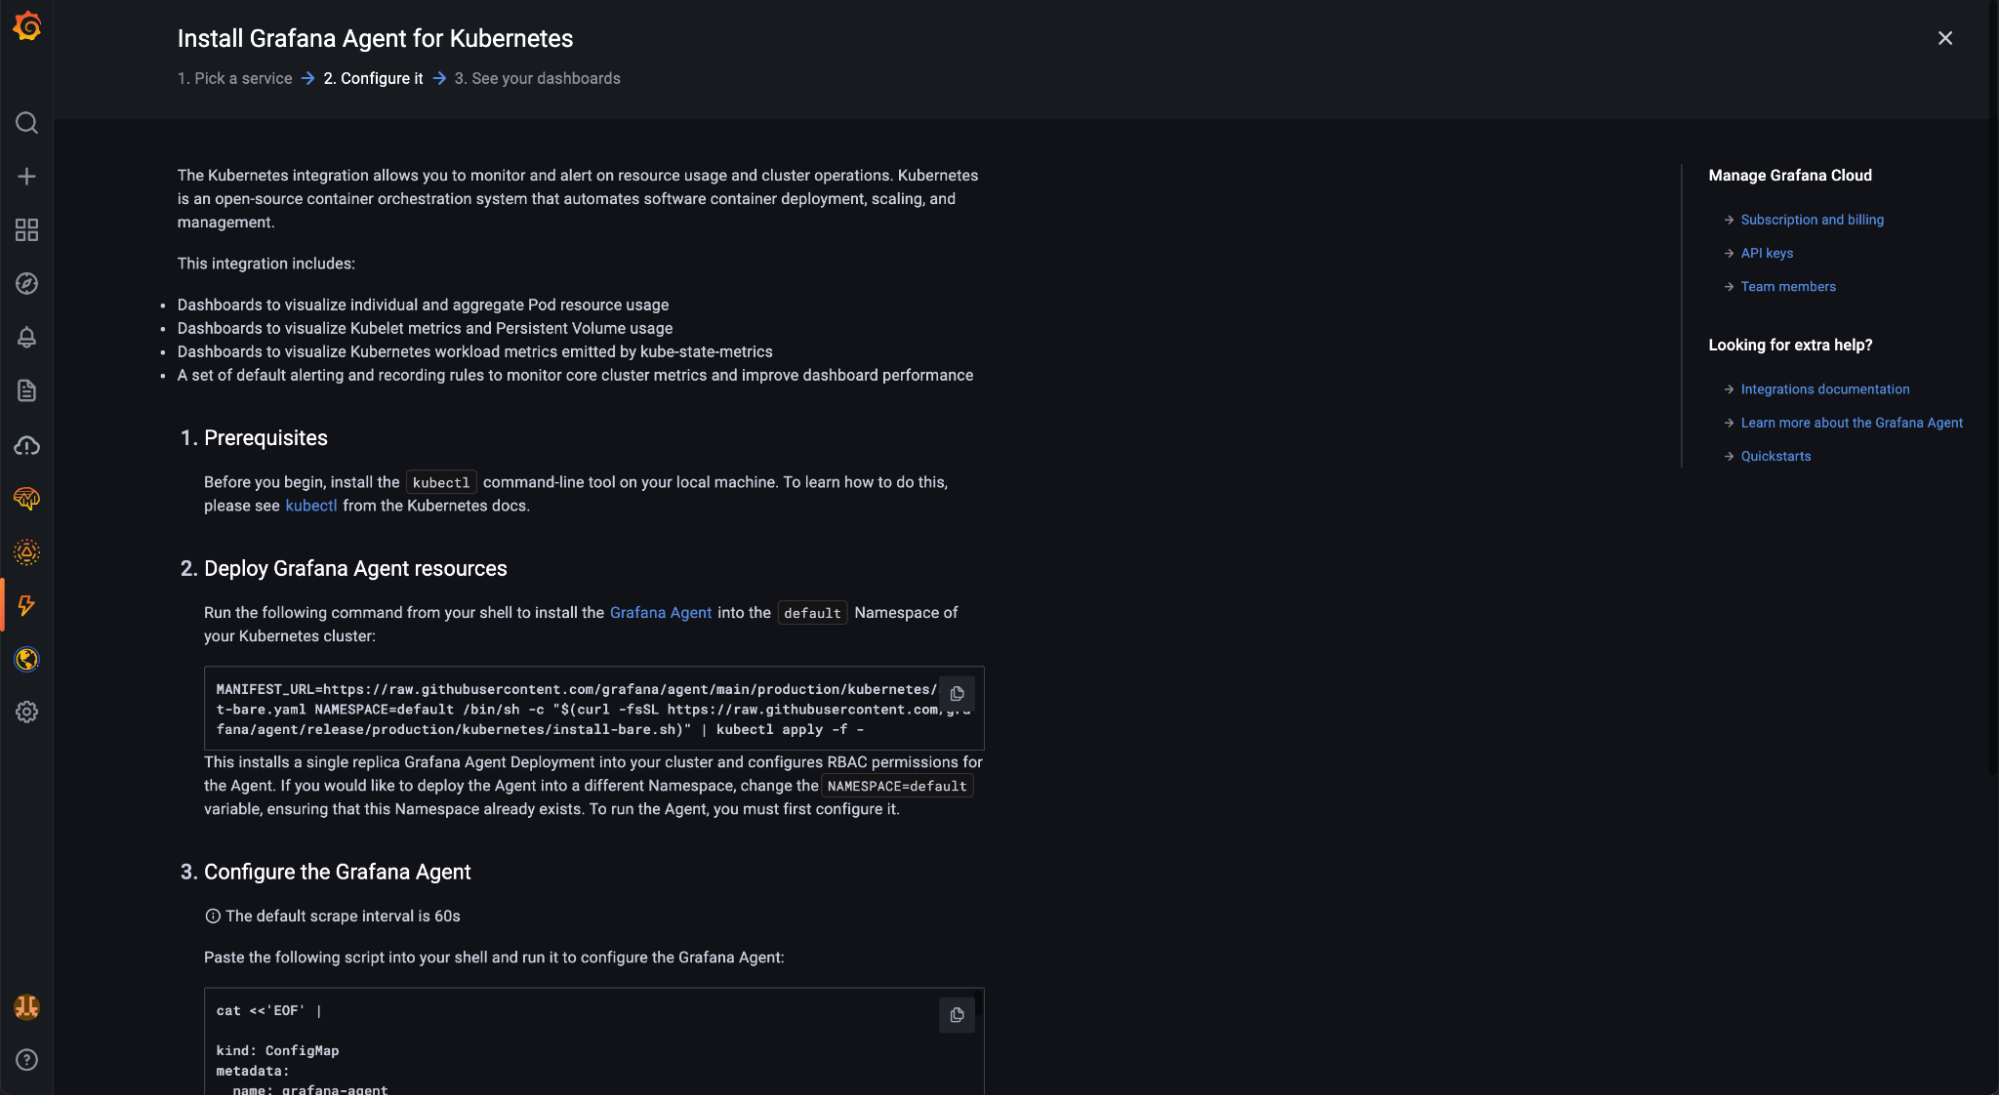
You’ve now deployed the Agent into your cluster and configured it to scrape the kubelet and cadvisor endpoints, and you are shipping these scraped metrics to Grafana Cloud.

In addition to metrics, you can also deploy additional Agents to collect logs and traces in your Kubernetes clusters by referencing these quickstart guides:
Note: This is currently being done with manual edits to config snippet, but we hope to also make this easier in the future so stay tuned for even more configuration improvements.
Step 3: Start using Kubernetes dashboards
Once you have finished installing the integration, you will have access to a number of dashboards so you can visualize your data being scraped.
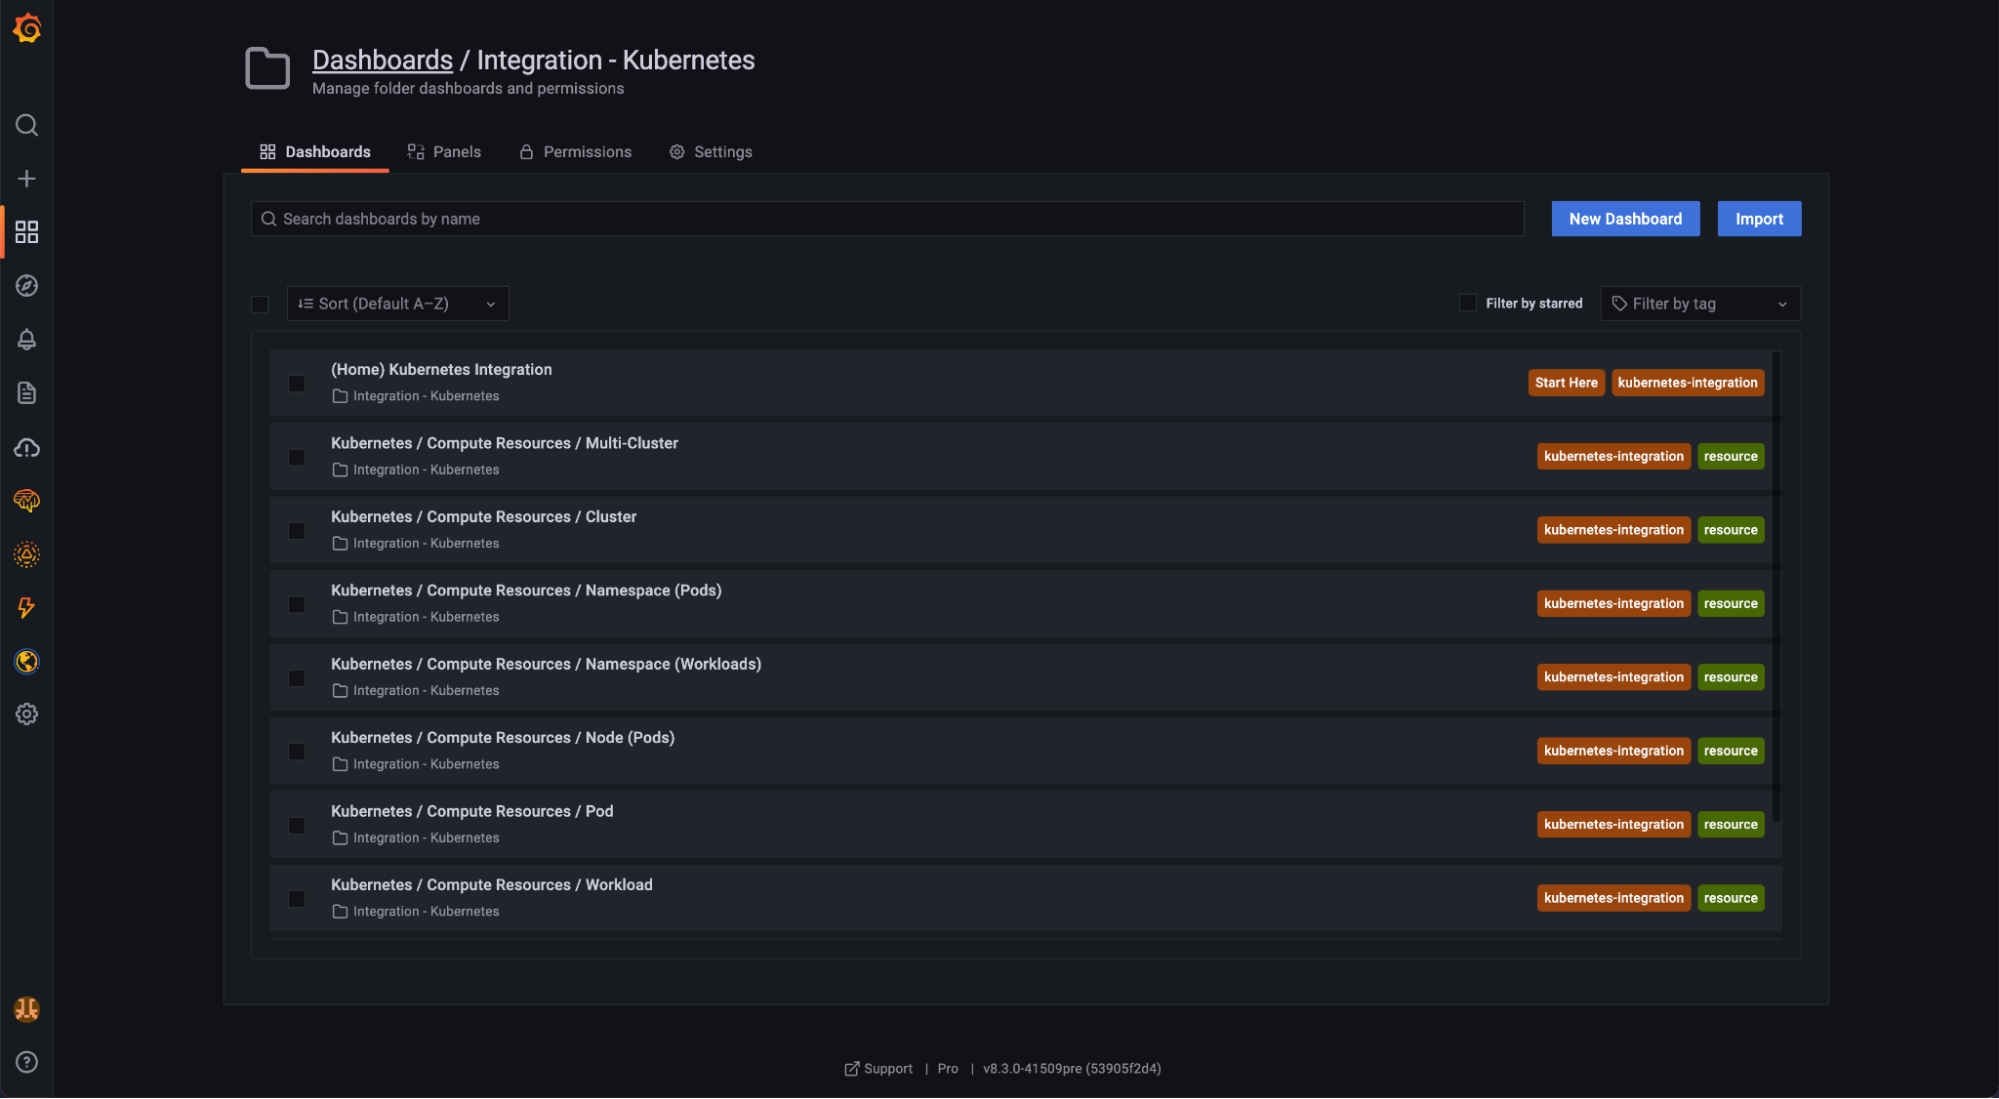
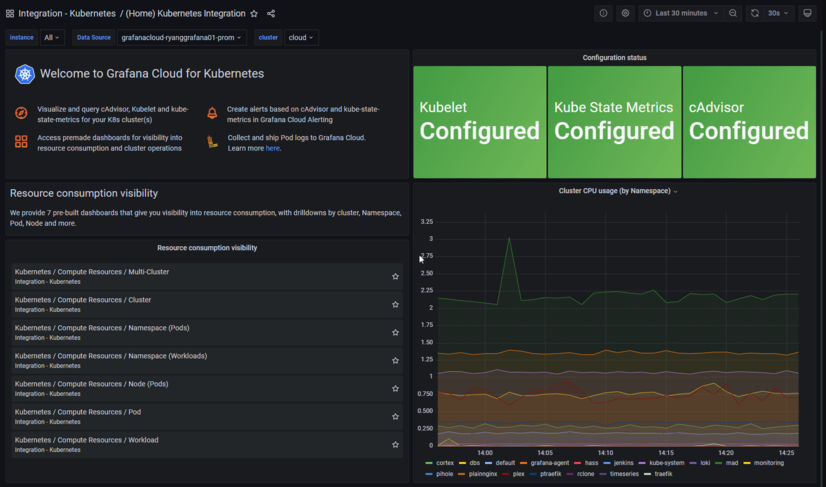
Kubernetes integration home dashboard
Start with (Home) Kubernetes integration. From this “homepage” style dashboard, there are two “paths” that you can access which take you to several pre-built dashboards based on what you’re interested in:
- Resource consumption visibility: compute resource dashboards at different levels, including pod, namespace, and cluster
- Cluster operations visibility: persistent volumes and kubelet dashboards
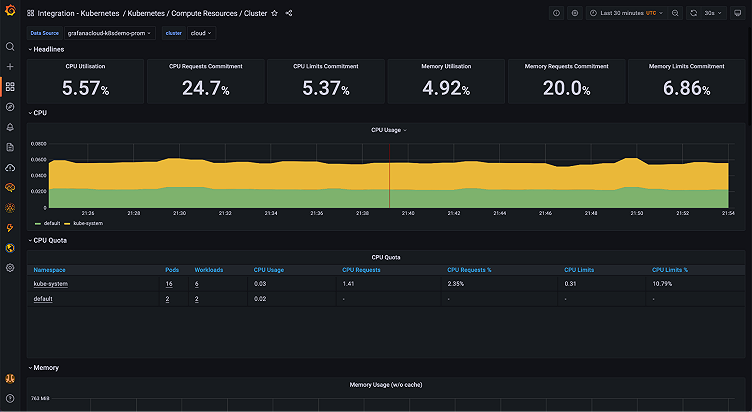
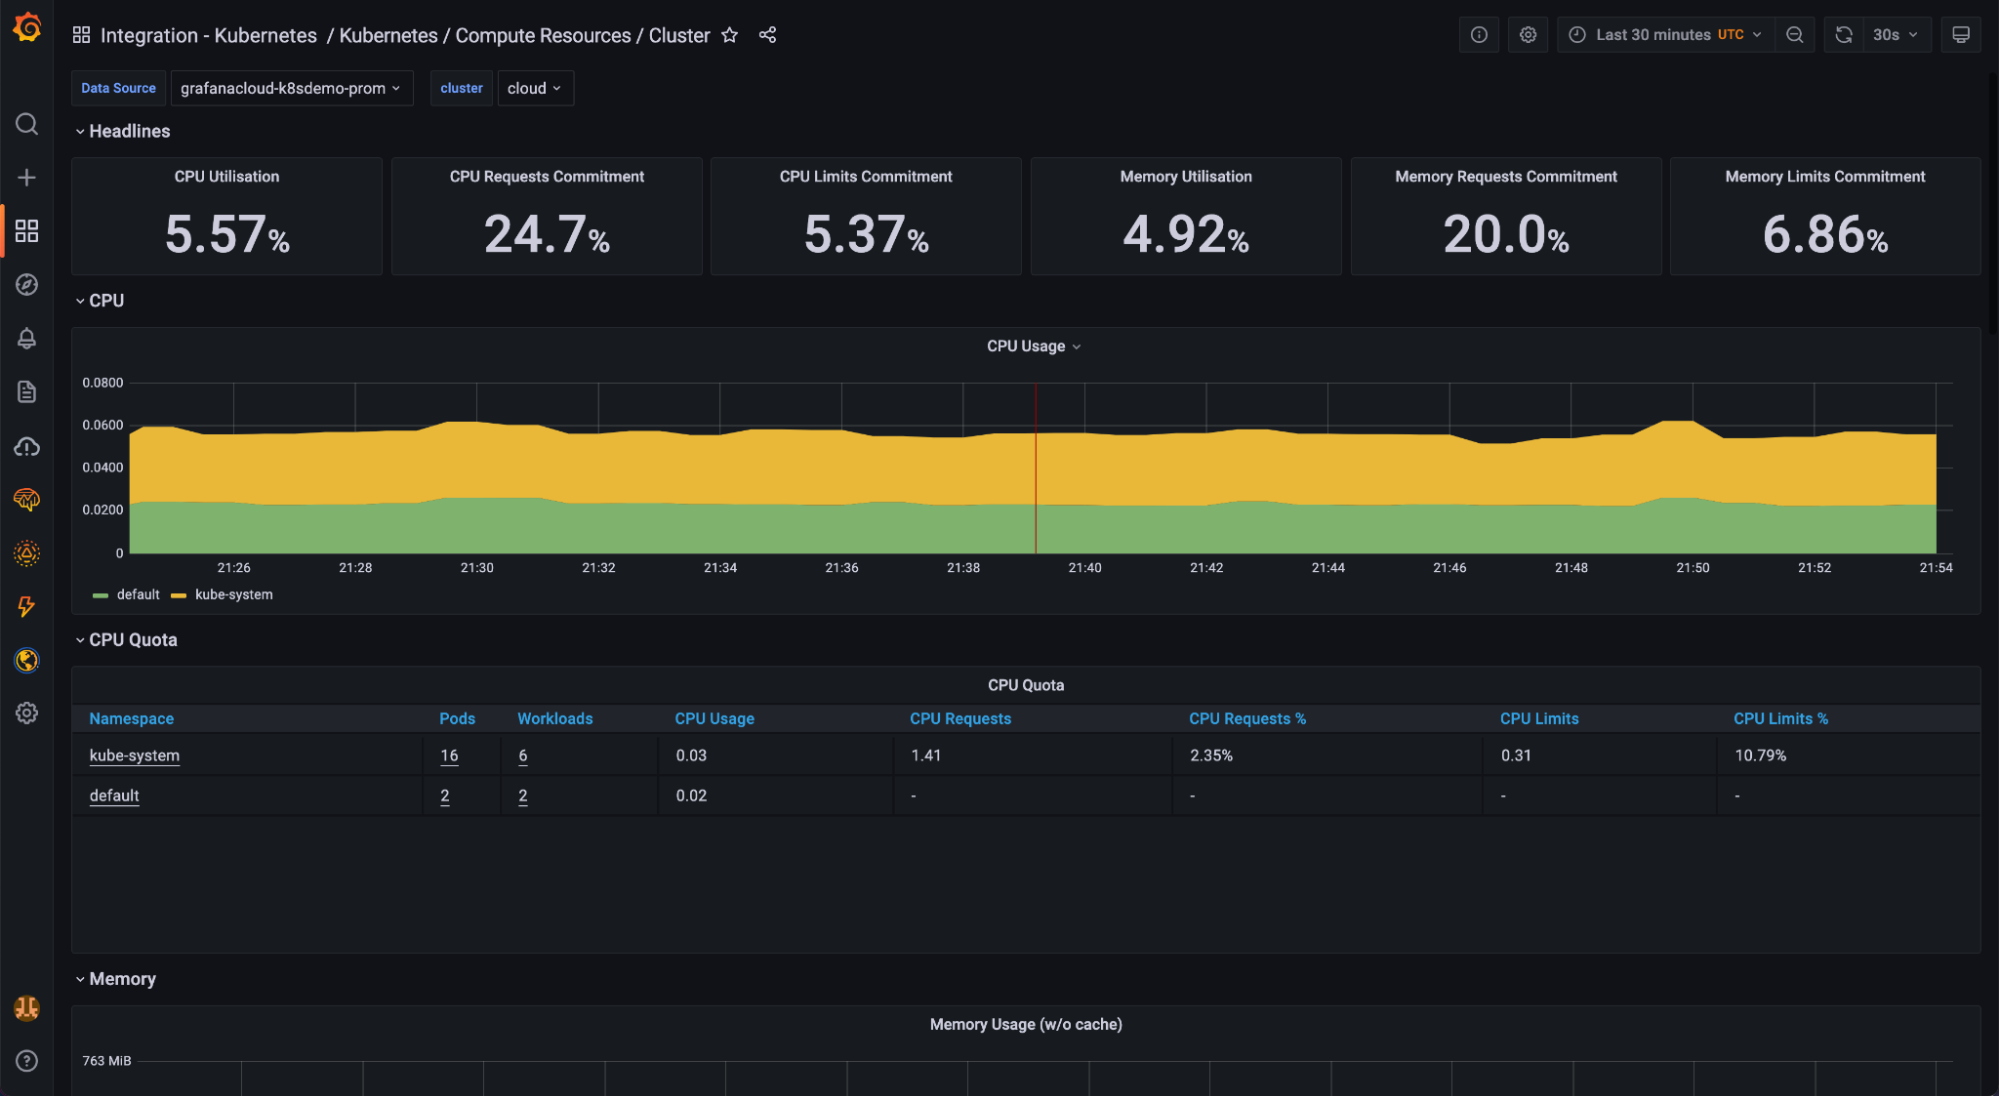
Cluster dashboard
Monitor your resource consumption across clusters by visualizing key indicators such as CPU & memory utilization, requests, and limits.
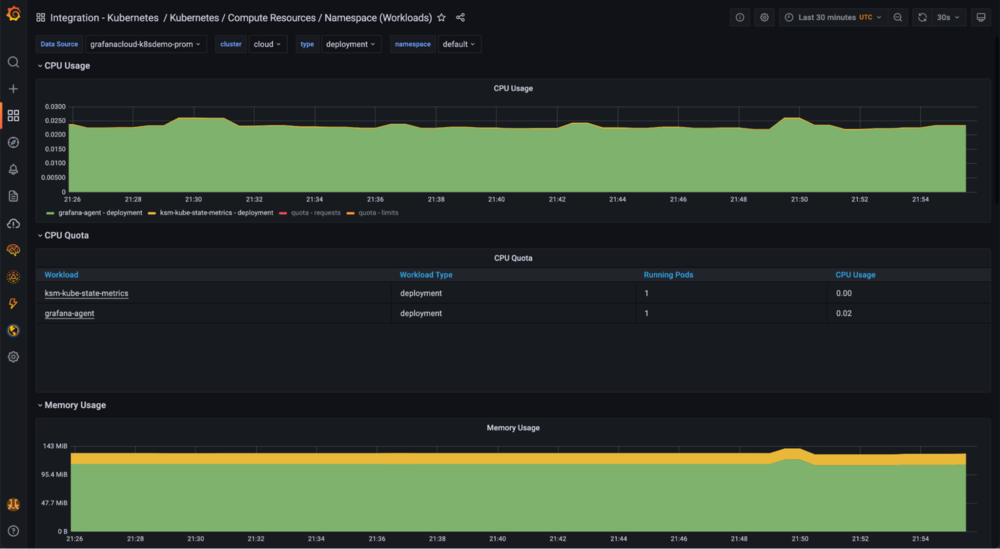
Namespace/workload dashboard
Visualize the resource consumption across your namespace/workload.
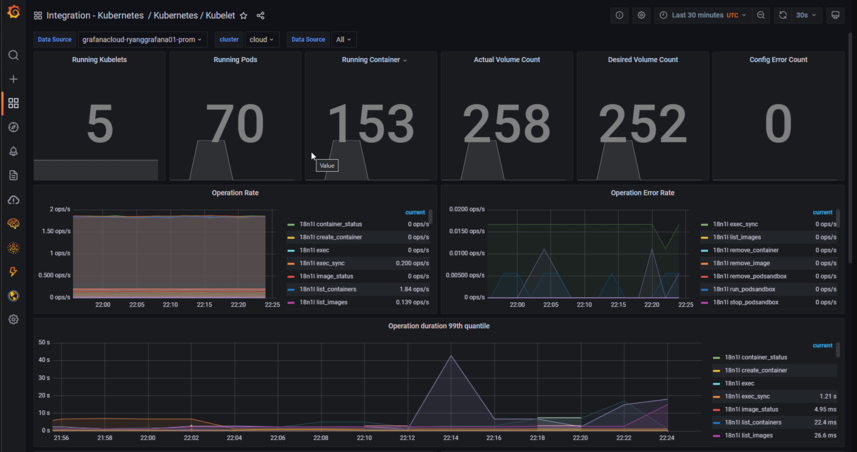
Kubelet dashboard
High-level Kubernetes operational metrics from the Kubelet data source.
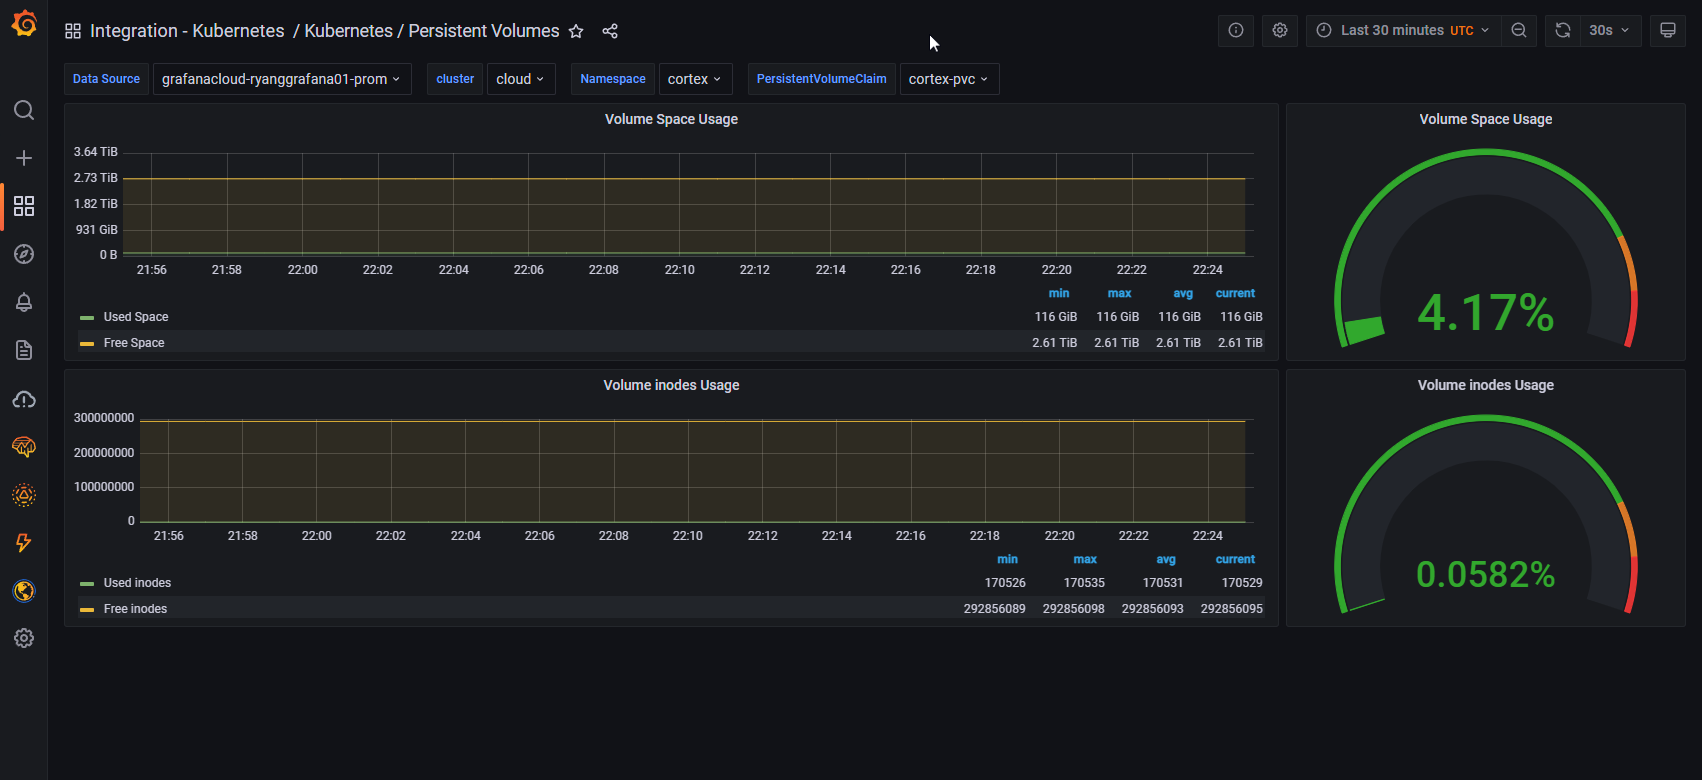
Persistent volumes dashboard
Monitor and alert on persistent volume metrics such as disk and inode usage.
Get started with the Kubernetes integration
The Kubernetes integration is available for all Grafana Cloud users, and it’s just one of 40+ integrations that come bundled with working dashboards, live alerts, and ready-to-go configurations.
To learn more, check out the ObservabilityCON 2021 session on the Kubernetes, Datadog, and AWS CloudWatch integrations for Grafana Cloud.
If you’re not already using Grafana Cloud, we have an actually useful free tier that includes 10k Prometheus metrics, 50GB Loki logs, 50GB Tempo traces, and three users. You can sign up for free now!
For more information on monitoring and alerting with the Kubernetes integration for Grafana Cloud, check out our documentation and our Kubernetes solutions page.
We’d also love to hear your feedback! Please join the #integrations channel in the Grafana Labs Community Slack.
Grafana Cloud is the easiest way to get started with metrics, logs, traces, and dashboards. We have a generous free forever tier and plans for every use case. Sign up for free now!

