
Introducing instant Kubernetes logging with Kubernetes Monitoring in Grafana Cloud
Kubernetes, Prometheus, and Grafana are a trio of technologies that have transformed cloud native development. However, despite how powerful these three technologies are, developers still face gaps in the process of implementing a mature Kubernetes environment.
One such shortcoming is that, like metrics, Kubernetes does not provide a native storage solution for logs. Grafana Cloud is now able to fill that need with Kubernetes Monitoring, the full solution for instrumenting out-of-the-box pod logs as well as metrics, alerting rules, and pre-built dashboards. The 10k series of metrics and 50GB of logs included in the generous free forever tier of Grafana Cloud are plenty to get started with your Kubernetes monitoring. (For new users who don’t have an account, you can sign up for a free account today.)
Why monitor Kubernetes pod logs?
Just like how metrics and logs are used to triage application issues, the same is true for troubleshooting and resolving infrastructure problems. While monitoring Kubernetes clusters with kube-state-metrics is highly recommended, without a logging solution, troubleshooting workflows can be incomplete. Once a logging solution for Kubernetes is set up and the visualization layer is in place, SREs are able to identify the root cause of an issue more quickly.
Kubernetes Monitoring uses Grafana Loki as its log aggregator, which was built to be compatible with Prometheus. The two technologies share labels, which means users are able to instantly correlate their Kubernetes telemetry. Correlated Kubernetes metrics and logs empower users to identify root causes faster, all while removing the burden of setting up and configuring multiple technologies.
Collect and visualize pod logs with Kubernetes Monitoring
1. Sign up for Grafana Cloud
Kubernetes Monitoring is exclusive to Grafana Cloud and available across all tiers, including our generous free forever plan. Then, once logged in, select the Kubernetes icon on the left-hand navigation bar.

2. Connect your data
To start using Kubernetes Monitoring, users must first connect their Kubernetes infrastructure data to Grafana Cloud. This is accomplished by deploying the Grafana Agent onto a cluster(s) or by using remote_write to forward kube-state-metrics to Grafana Cloud. The following components will collect data at the time of installation:
- Grafana Agent single-replica StatefulSet that will collect Prometheus metrics and Kubernetes events from objects in your cluster.
- Kube-state-metrics Helm chart, which deploys a KSM deployment and service, along with some other access control objects.
- Grafana Agent DaemonSet that will collect logs from pods in your cluster.
Once the Grafana Agent is deployed, data will start streaming to your Grafana Cloud stack.

3. Configure your data
Metrics ingested by Kubernetes Monitoring are largely opinionated and based on the Kubernetes mixin project. Users can also further configure their ingested data in a way that tailors to their specific use case.
By default, Kubernetes Monitoring scrapes cAdvisor (1 per node), kubelet (1 per node), and kube-state-metrics (1 replica by default) endpoints at 60-second intervals. In order to adjust the default metrics being scraped or the scrape interval, please see our Kubernetes Monitoring documentation for more details.
Benefits beyond Kubernetes pod logs
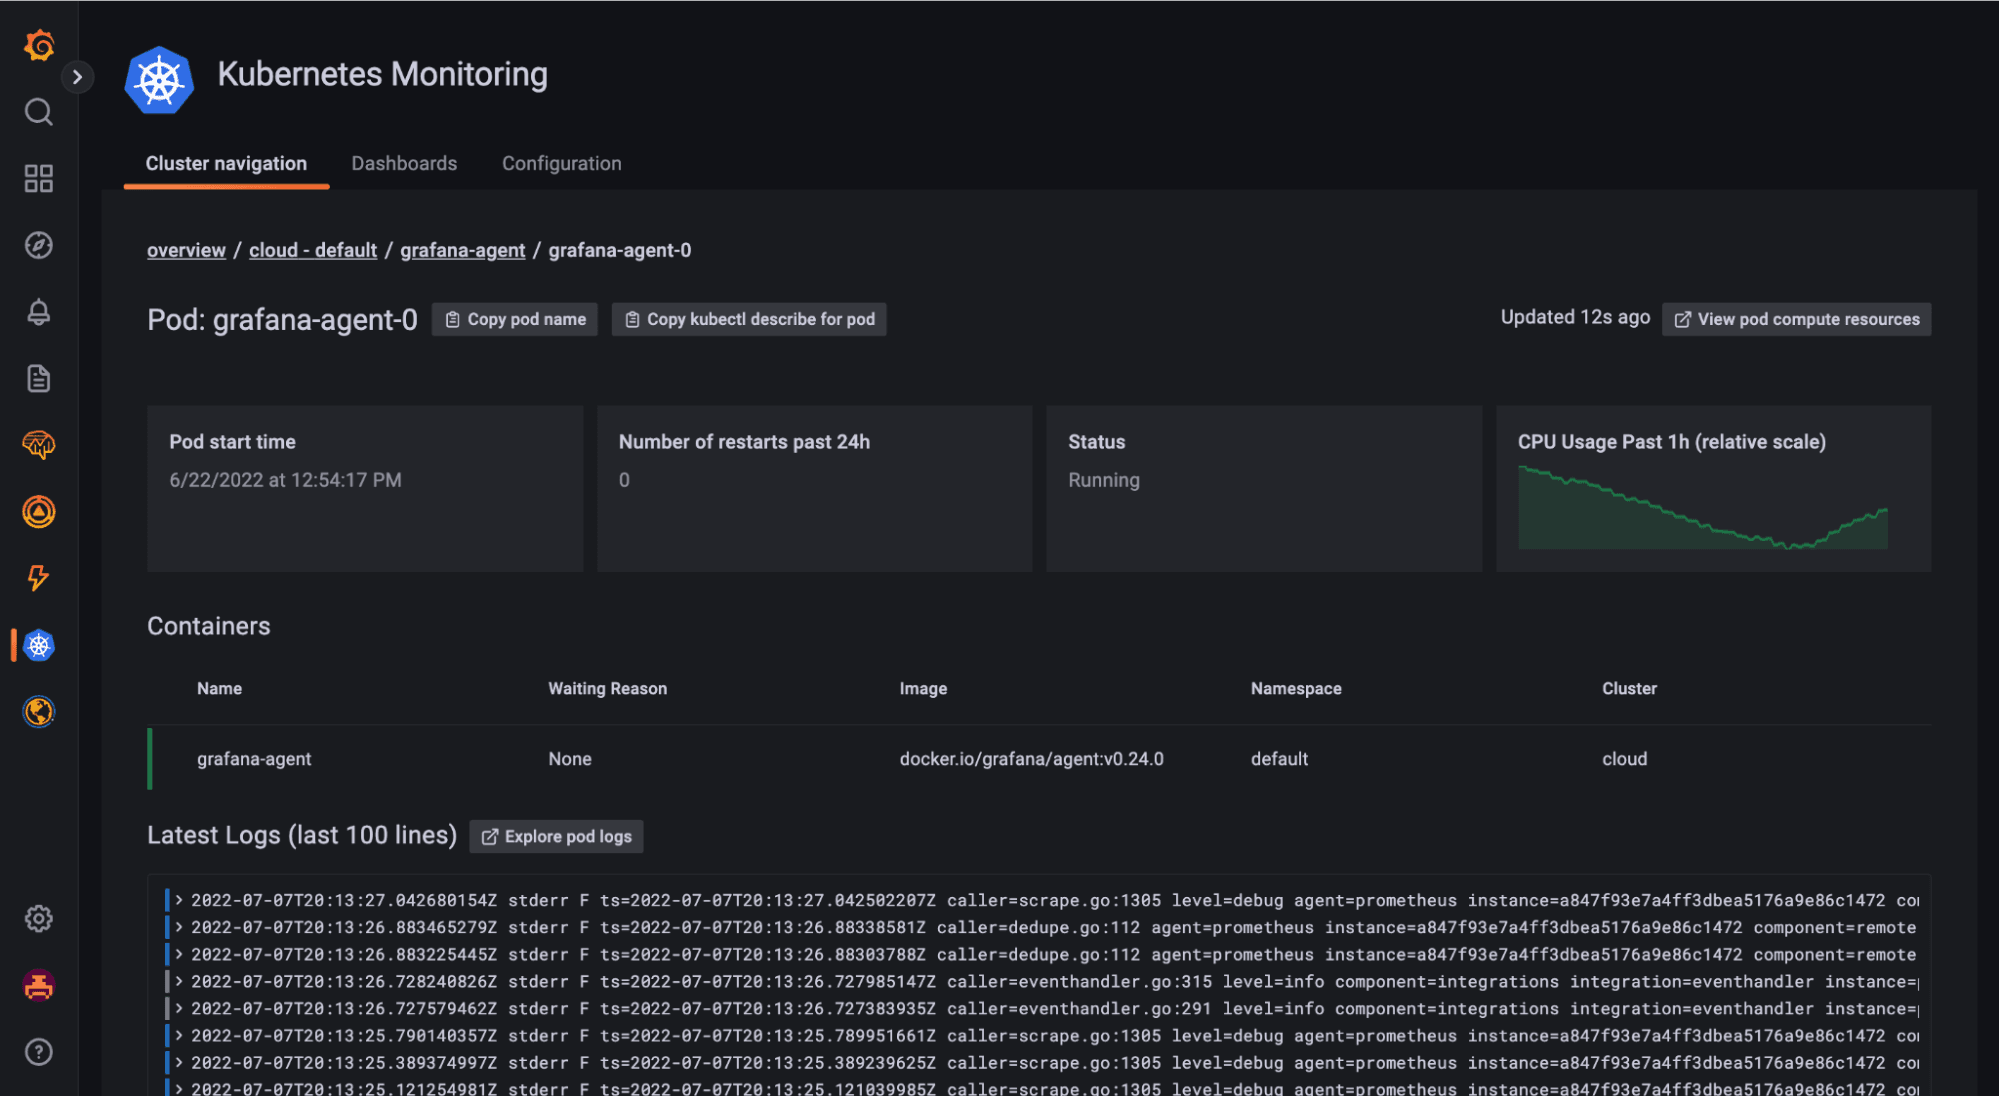
Once you get started with Kubernetes Monitoring in Grafana Cloud and begin to visualize your Kubernetes logs, you will also have access to a host of other useful features. The cluster navigation view is a navigable, nested cluster interface that allows users to swiftly detect root cause issues with correlation across metrics and logs, as well as relaying pod-specific Kubernetes events.

Additionally, users are able to bypass the days of toil required to configure dashboards and alerts with pre-built dashboards and alerting rules. To learn more about Kubernetes Monitoring, please visit our Kubernetes solutions page.
If you’re not already using Grafana Cloud — the easiest way to get started with observability — sign up now for a free 14-day trial of Grafana Cloud Pro, with unlimited metrics, logs, traces, and users, long-term retention, and access to one Enterprise plugin.

