First components and the standard library in Grafana Alloy
This tutorial covers the basics of the Alloy configuration syntax and the standard library. It introduces a basic pipeline that collects metrics from the host and sends them to Prometheus.
Before you begin
To complete this tutorial:
- You must set up a local Grafana instance.
Recommended reading
Alloy configuration syntax basics
An Alloy configuration file contains three elements:
Attributes
key = valuepairs used to configure individual settings.url = "http://localhost:9090"Expressions
Expressions are used to compute values. They can be constant values, for example
"localhost:9090". They can be more complex, for example, referencing a component’s export:prometheus.exporter.unix.targets. They can also be a mathematical expression:(1 + 2) * 3, or a standard library function call:sys.env("HOME"). If you are curious, you can find a list of available standard library functions in the Standard library documentation.Blocks
Blocks are used to configure components with groups of attributes or nested blocks. The following example block can be used to configure the logging output of Alloy:
logging {
    level  = "debug"
    format = "json"
}
Note
The default log level is
infoand the default log format islogfmt.Try pasting this into
config.alloyand running<BINARY_FILE_PATH> run config.alloyto see what happens. Replace<BINARY_FILE_PATH>with the path to the Alloy binary.Congratulations, you’ve just written your first Alloy configuration file. This configuration won’t do anything. In the next step, you add some functionality to this configuration.
Note
Comments in Alloy syntax are prefixed with
//and are single-line only. For example:// This is a comment.
Components
Components are the building blocks of an Alloy configuration. They’re configured and linked to create pipelines that collect, process, and output your telemetry data. Components are configured with Arguments and have Exports that may be referenced by other components.
Recommended reading
An example pipeline
Look at the following simple pipeline:
local.file "example" {
    filename = sys.env("HOME") + "/file.txt"
}

prometheus.remote_write "local_prom" {
    endpoint {
        url = "http://localhost:9090/api/v1/write"

        basic_auth {
            username = "admin"
            password = local.file.example.content
        }
    }
}
Note
A list of all available components can be found in the Component reference. Each component has a link to its documentation, which contains a description of what the component does, its arguments, its exports, and examples.
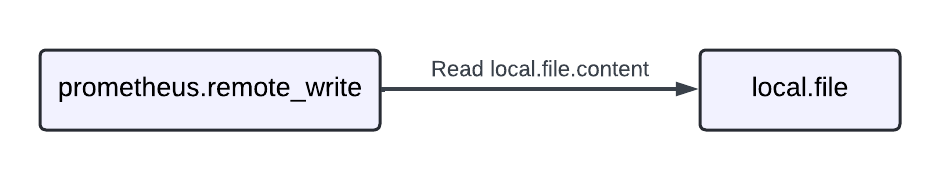
This pipeline has two components: local.file and prometheus.remote_write.
The local.file component is configured with a single argument, filename, which is set by calling the sys.env standard library function to retrieve the value of the HOME environment variable and concatenating it with the string "file.txt".
The local.file component has a single export, content, which contains the contents of the file.
The prometheus.remote_write component is configured with an endpoint block, containing the url attribute and a basic_auth block.
The url attribute is set to the URL of the Prometheus remote write endpoint.
The basic_auth block contains the username and password attributes, which are set to the string "admin" and the content export of the local.file component, respectively.
The content export is referenced by using the syntax local.file.example.content, where local.file.example is the fully qualified name of the component (the component’s type + its label) and content is the name of the export.
Note
The
local.filecomponent’s label is set to"example", so the fully qualified name of the component islocal.file.example. Theprometheus.remote_writecomponent’s label is set to"local_prom", so the fully qualified name of the component isprometheus.remote_write.local_prom.
This example pipeline still doesn’t do anything, so it’s time to add some more components to it.
Send your first metrics
Now that you have a simple pipeline, you can send your first metrics.
Recommended reading
- Optional:
prometheus.exporter.unix - Optional:
prometheus.scrape - Optional:
prometheus.remote_write
Modify your pipeline and scrape the metrics
Make a simple pipeline with a prometheus.exporter.unix component, a prometheus.scrape component to scrape it, and a prometheus.remote_write component to send the scraped metrics to Prometheus.
prometheus.exporter.unix "localhost" {
    // This component exposes a lot of metrics by default, so we will keep all of the default arguments.
}

prometheus.scrape "default" {
    // Setting the scrape interval lower to make it faster to be able to see the metrics
    scrape_interval = "10s"

    targets    = prometheus.exporter.unix.localhost.targets
    forward_to = [
        prometheus.remote_write.local_prom.receiver,
    ]
}

prometheus.remote_write "local_prom" {
    endpoint {
        url = "http://localhost:9090/api/v1/write"
    }
}
Run Alloy with the following command:
<BINARY_FILE_PATH> run config.alloyReplace the following:
<BINARY_FILE_PATH>: The path to the Alloy binary.
Navigate to http://localhost:3000/explore in your browser.
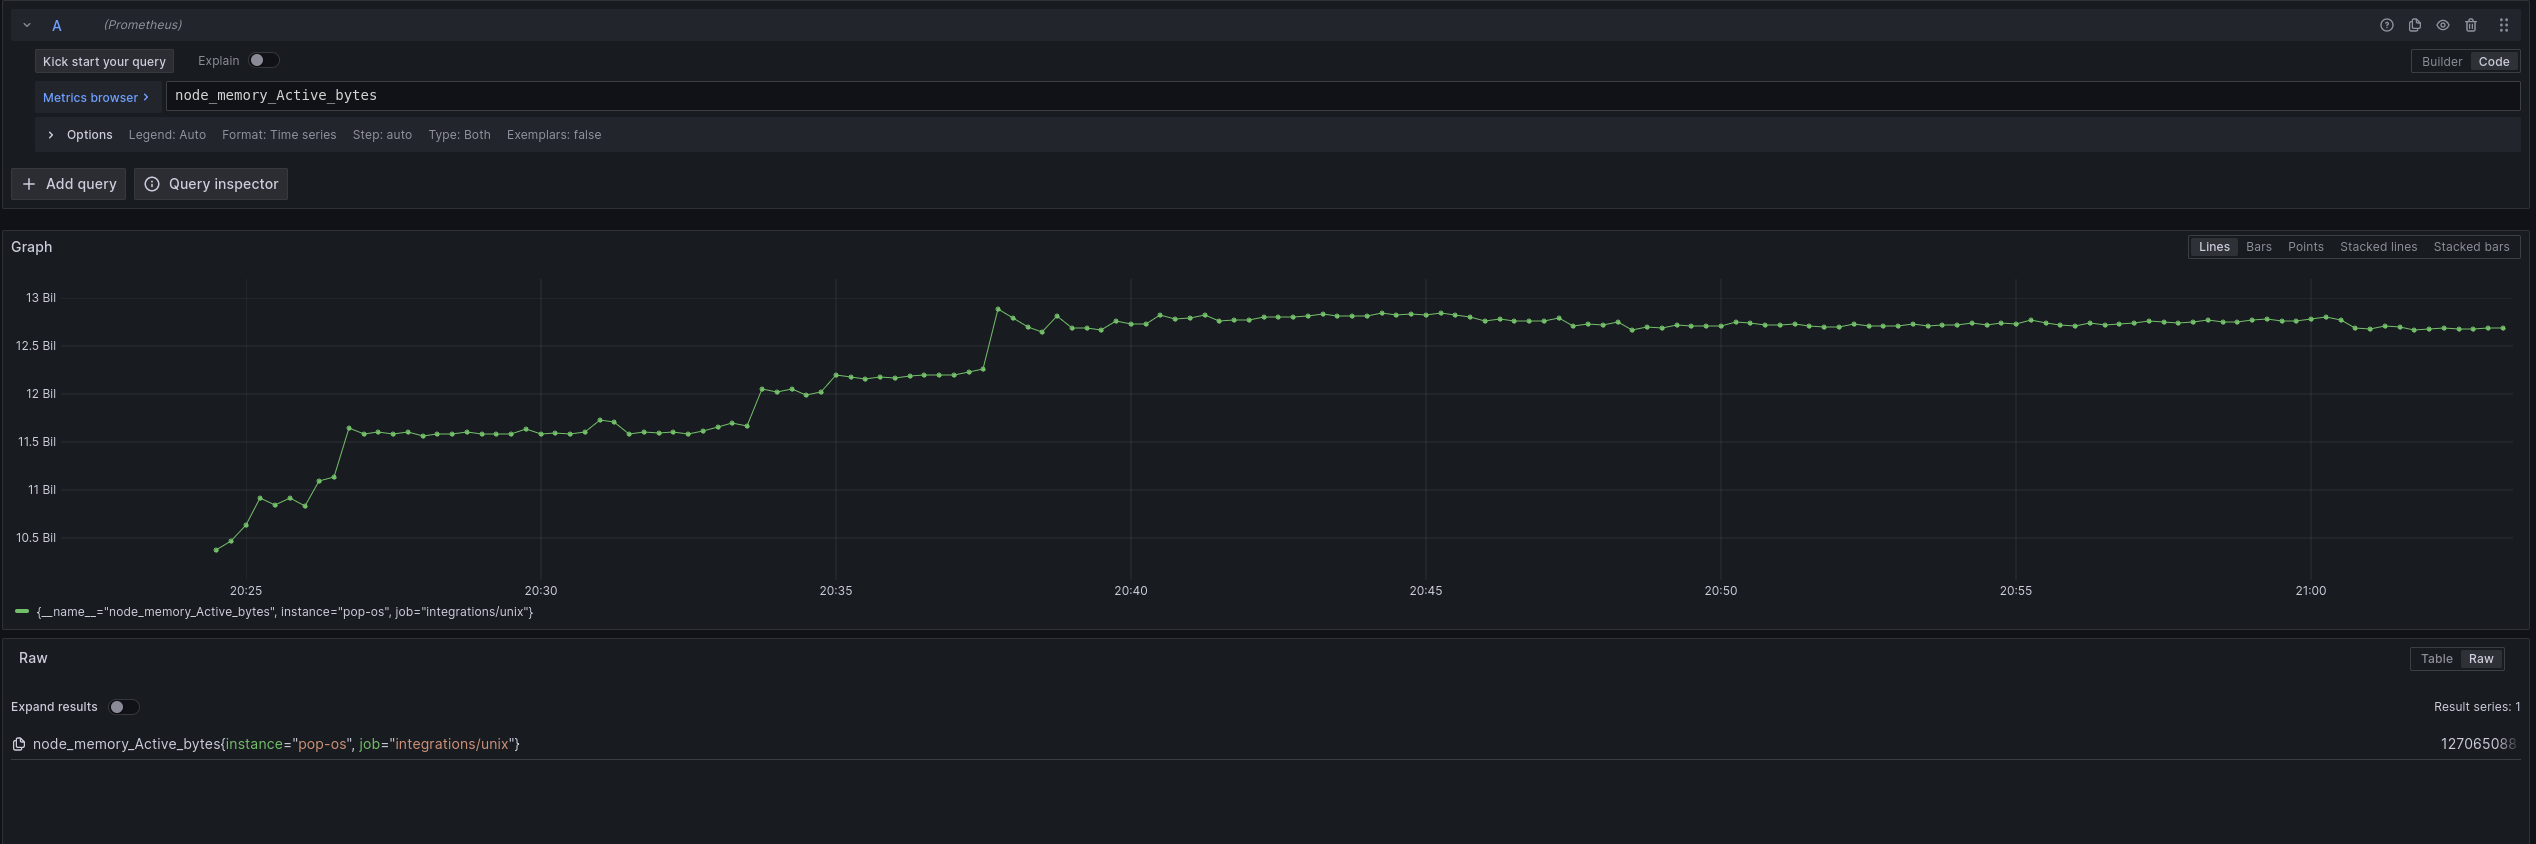
After ~15-20 seconds, you should be able to see the metrics from the prometheus.exporter.unix component.
Try querying for node_memory_Active_bytes to see the active memory of your host.
Visualize the relationship between components
The following diagram is an example pipeline:
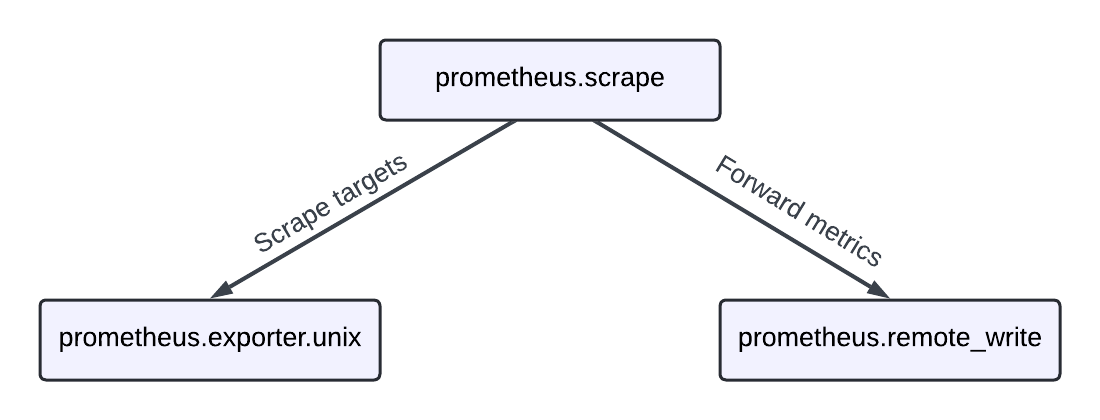
Your pipeline configuration defines three components:
prometheus.scrape- A component that scrapes metrics from components that export targets.prometheus.exporter.unix- A component that exports metrics from the host, built around node_exporter.prometheus.remote_write- A component that sends metrics to a Prometheus remote-write compatible endpoint.
The prometheus.scrape component references the prometheus.exporter.unix component’s targets export, which is a list of scrape targets.
The prometheus.scrape component forwards the scraped metrics to the prometheus.remote_write component.
One rule is that components can’t form a cycle. This means that a component can’t reference itself directly or indirectly. This is to prevent infinite loops from forming in the pipeline.
Exercise
The following exercise guides you through modifying your pipeline to scrape metrics from Redis.
Recommended Reading
- Optional:
prometheus.exporter.redis
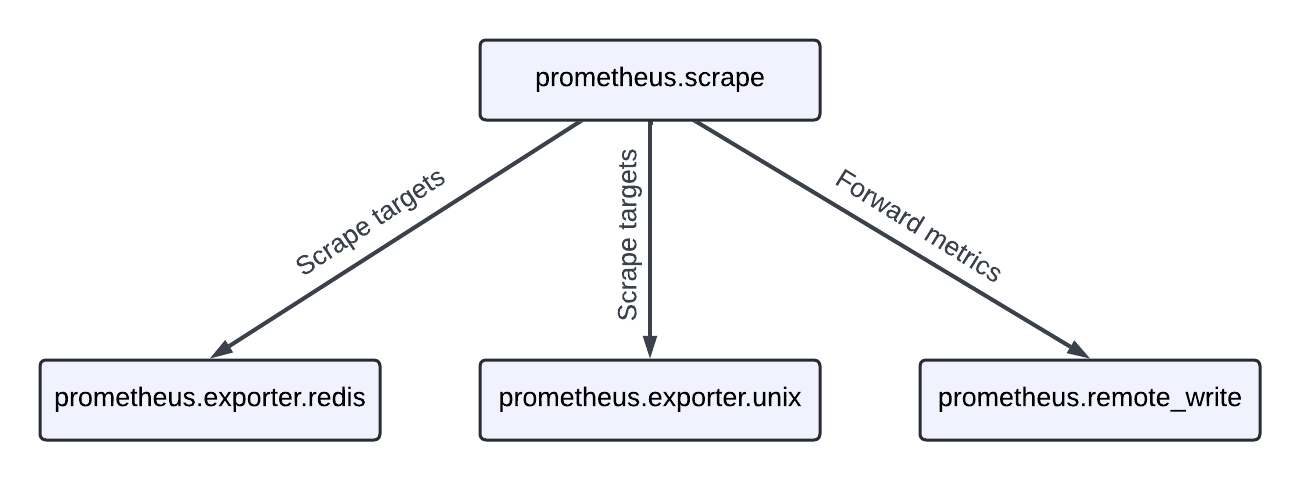
Start a container running Redis and configure Alloy to scrape the metrics.
docker container run -d --name alloy-redis -p 6379:6379 --rm redisTry modifying the pipeline to scrape metrics from the Redis exporter.
You can refer to the prometheus.exporter.redis component documentation for more information on how to configure it.
To give a visual hint, you want to create a pipeline that looks like this:
Tip
Refer to the
array.concatstandard library function for information about combining lists of values into a single list.
You can run Alloy with the new configuration file with the following command:
<BINARY_FILE_PATH> run config.alloyReplace the following:
<BINARY_FILE_PATH>: The path to the Alloy binary.
Navigate to http://localhost:3000/explore in your browser.
After the first scrape, you should be able to query for redis metrics as well as node metrics.
To shut down the Redis container, run:
docker container stop alloy-redisIf you get stuck, you can always view a solution here:
// Configure your first components, learn about the standard library, and learn how to run Grafana Alloy

// prometheus.exporter.redis collects information about Redis and exposes
// targets for other components to use
prometheus.exporter.redis "local_redis" {
    redis_addr = "localhost:6379"
}

prometheus.exporter.unix "localhost" { }

// prometheus.scrape scrapes the targets that it is configured with and forwards
// the metrics to other components (typically prometheus.relabel or prometheus.remote_write)
prometheus.scrape "default" {
    // This is scraping too often for typical use-cases, but is easier for testing and demo-ing!
    scrape_interval = "10s"

    // Here, prometheus.exporter.redis.local_redis.targets refers to the 'targets' export
    // of the prometheus.exporter.redis component with the label "local_redis".
    //
    // If you have more than one set of targets that you would like to scrape, you can use
    // the 'array.concat' function from the standard library to combine them.
    targets    = array.concat(prometheus.exporter.redis.local_redis.targets, prometheus.exporter.unix.localhost.targets)
    forward_to = [prometheus.remote_write.local_prom.receiver]
}

// prometheus.remote_write exports a 'receiver', which other components can forward
// metrics to and it will remote_write them to the configured endpoint(s)
prometheus.remote_write "local_prom" {
    endpoint {
        url = "http://localhost:9090/api/v1/write"
    }
}
Finish up and next steps
You might have noticed that running Alloy with the configurations created a directory called data-alloy in the directory you ran Alloy from.
This directory is where components can store data, such as the prometheus.exporter.unix component storing its Write Ahead Log (WAL).
If you look in the directory, do you notice anything interesting? The directory for each component is the fully qualified name.
If you’d like to store the data elsewhere, you can specify a different directory by supplying the --storage.path flag to Alloy’s run command, for example, <BINARY_FILE_PATH> run config.alloy --storage.path /etc/alloy. Replace <BINARY_FILE_PATH> with the path to the Alloy binary.
Generally, you can use a persistent directory for this, as some components may use the data stored in this directory to perform their function.
In the next tutorial, you learn how to configure Alloy to collect logs from a file and send them to Loki. You also learn how to use different components to process metrics and logs.


